
Biophysical Characterization of Viral and Lipid-Based Vectors for Vaccines and Therapeutics with Light Scattering and Calorimetric Techniques

Abstract
:1. Introduction
2. Materials and Methods
2.1. Materials
2.2. Methods
2.2.1. Dynamic Light Scattering (DLS)
2.2.2. Multi-Angle Dynamic Light Scattering (MADLS)
2.2.3. DLS Thermal Ramps
2.2.4. Nanoparticle Tracking Analysis (NTA)
2.2.5. Electrophoretic Light Scattering (ELS)
2.2.6. Size-Exclusion Chromatography Static Light Scattering (SEC-SLS)
2.2.7. Differential Scanning Calorimetry (DSC)
3. Results
3.1. Size Distribution and Sample Polydispersity
3.1.1. What Sizing Techniques Work for Vectors >50 nm?
3.1.2. What Sizing Techniques Work for Vectors <50 nm?
3.1.3. Viral and Non-Viral Vector Polydispersity by DLS, MADLS, NTA and SEC-SLS
3.1.4. What Can Be Said about Sample Polydispersity?
3.1.5. What Can Be Learnt about the Polydispersity of the Main Population?
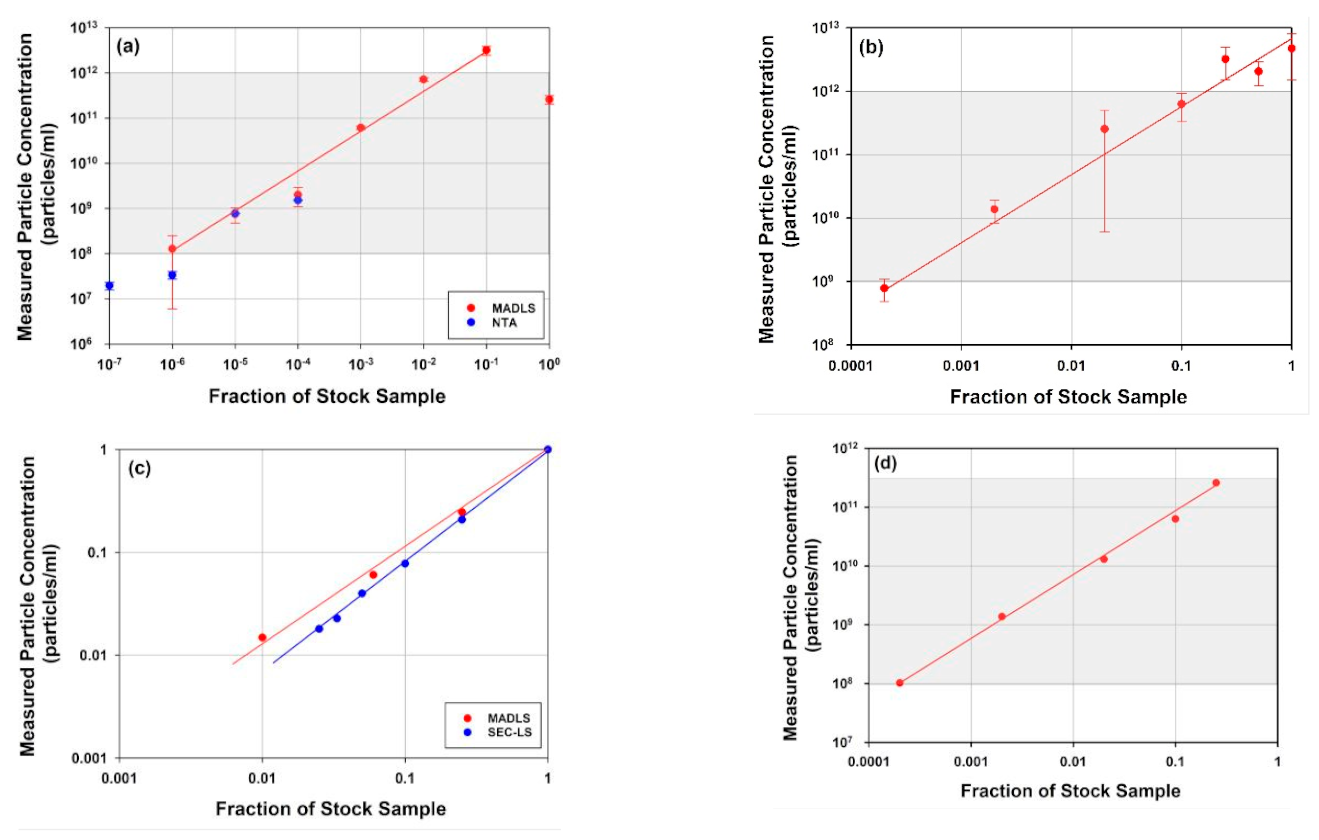
3.2. Particle Concentration of Viral Capside Titer
3.2.1. What Concentration Range Can Be Measured for a Particular Vector?
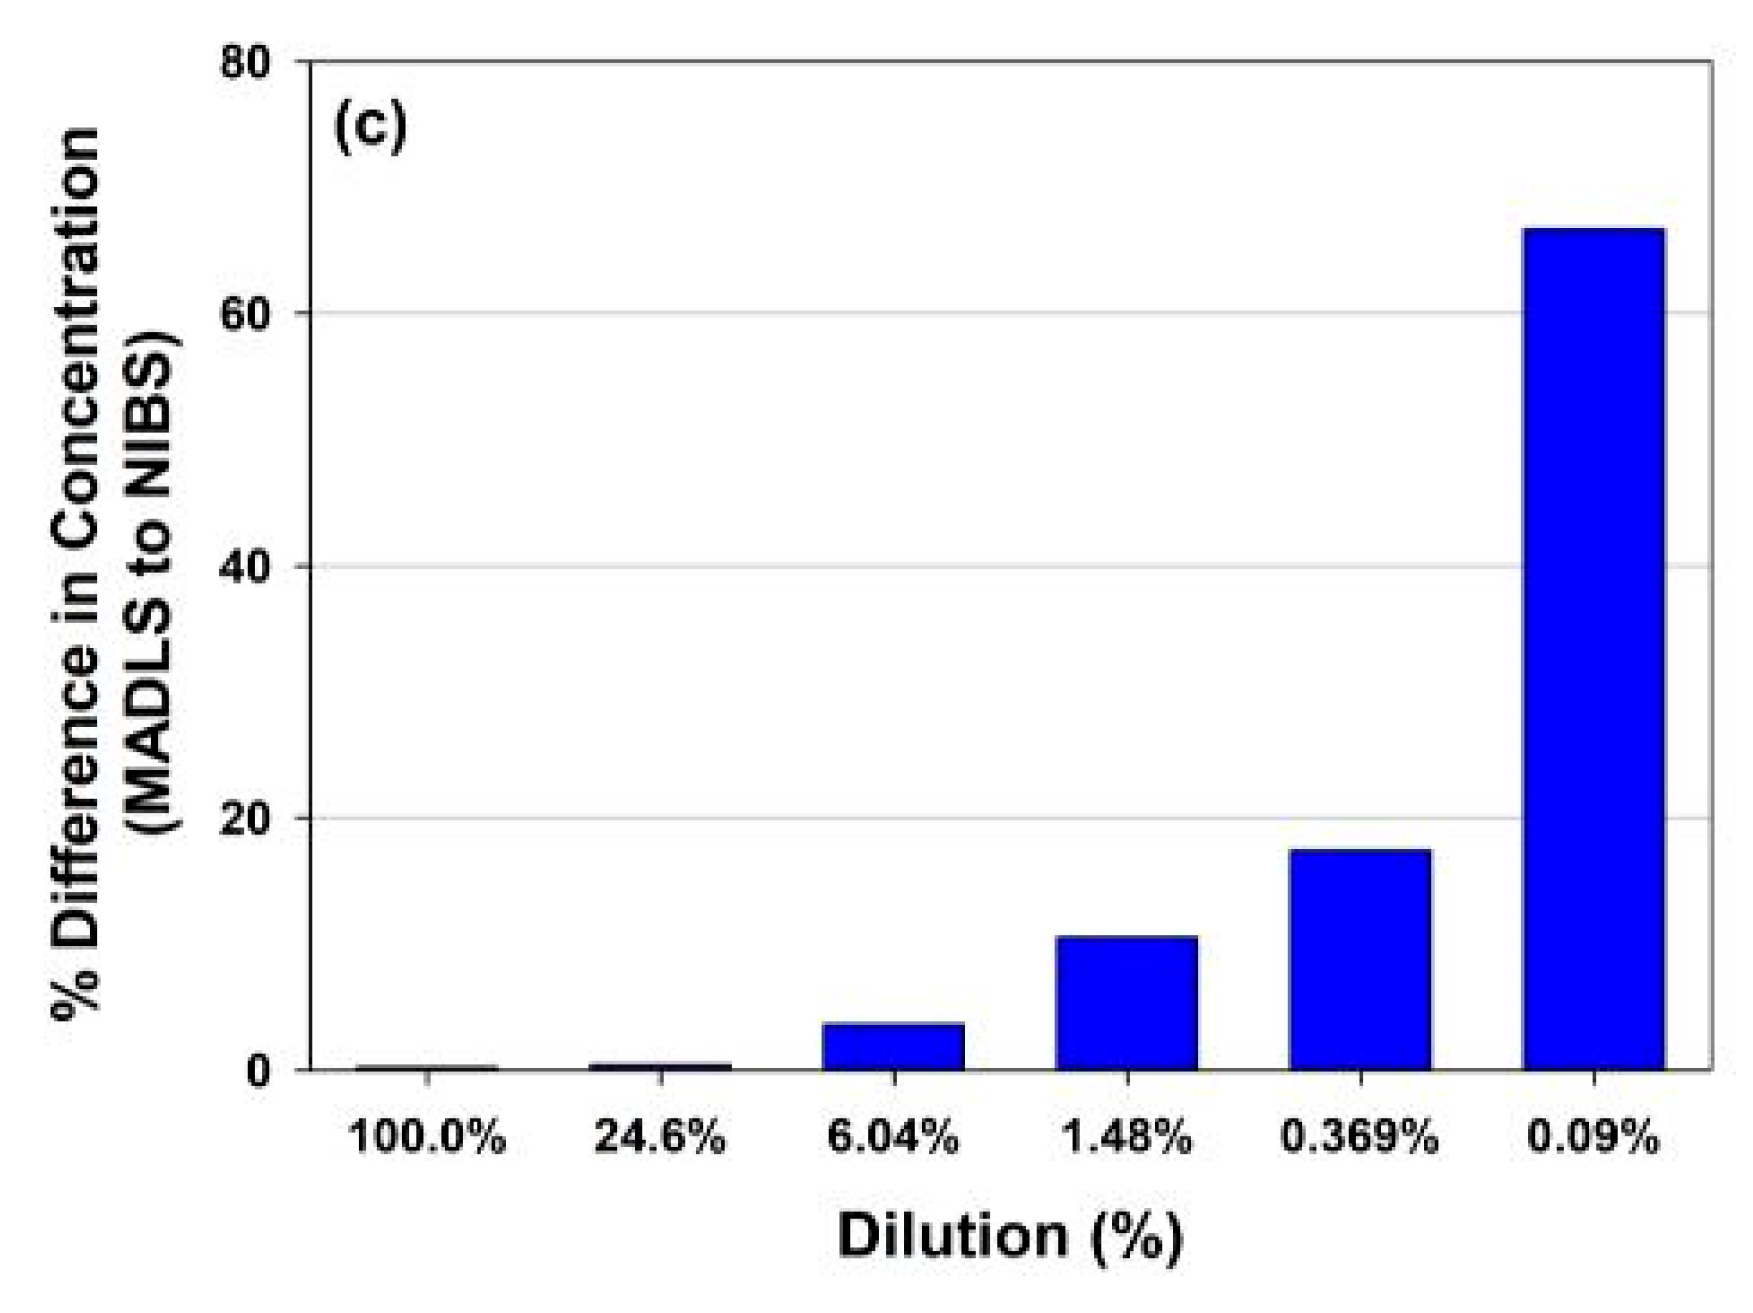
3.2.2. MADLS Extends the Measurement Range for Heterogenous Samples
3.3. Identification of Components and Quantification of Payload
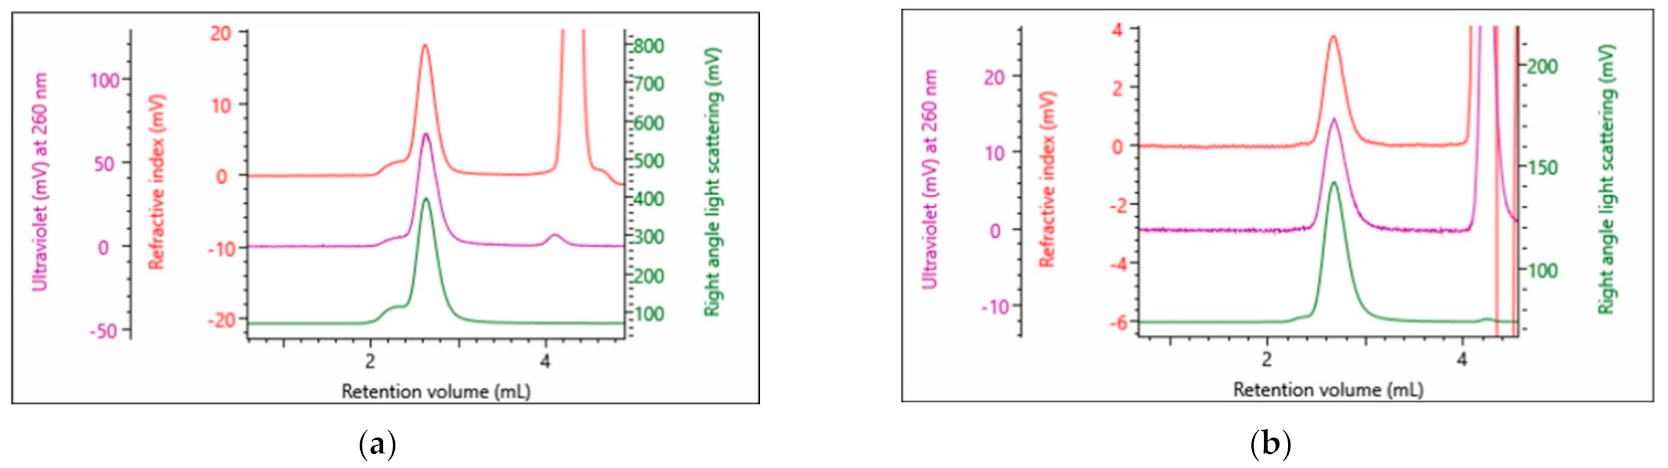
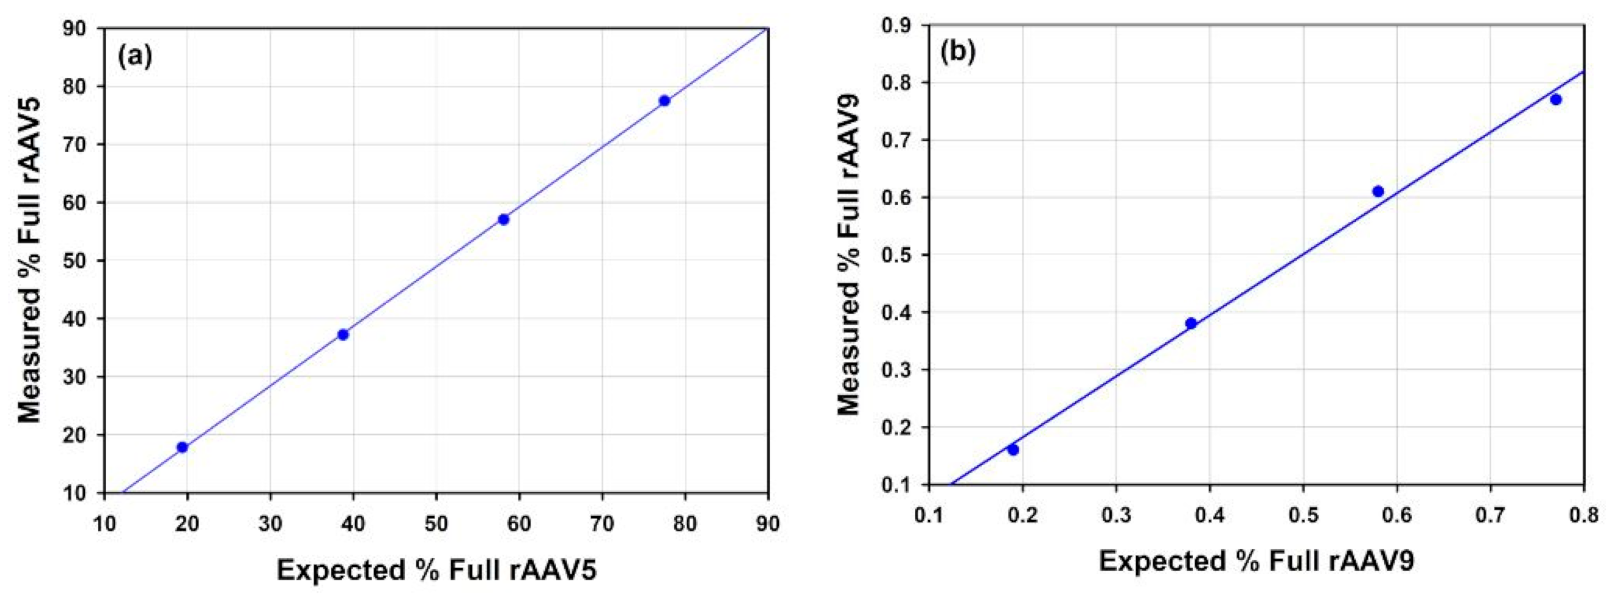
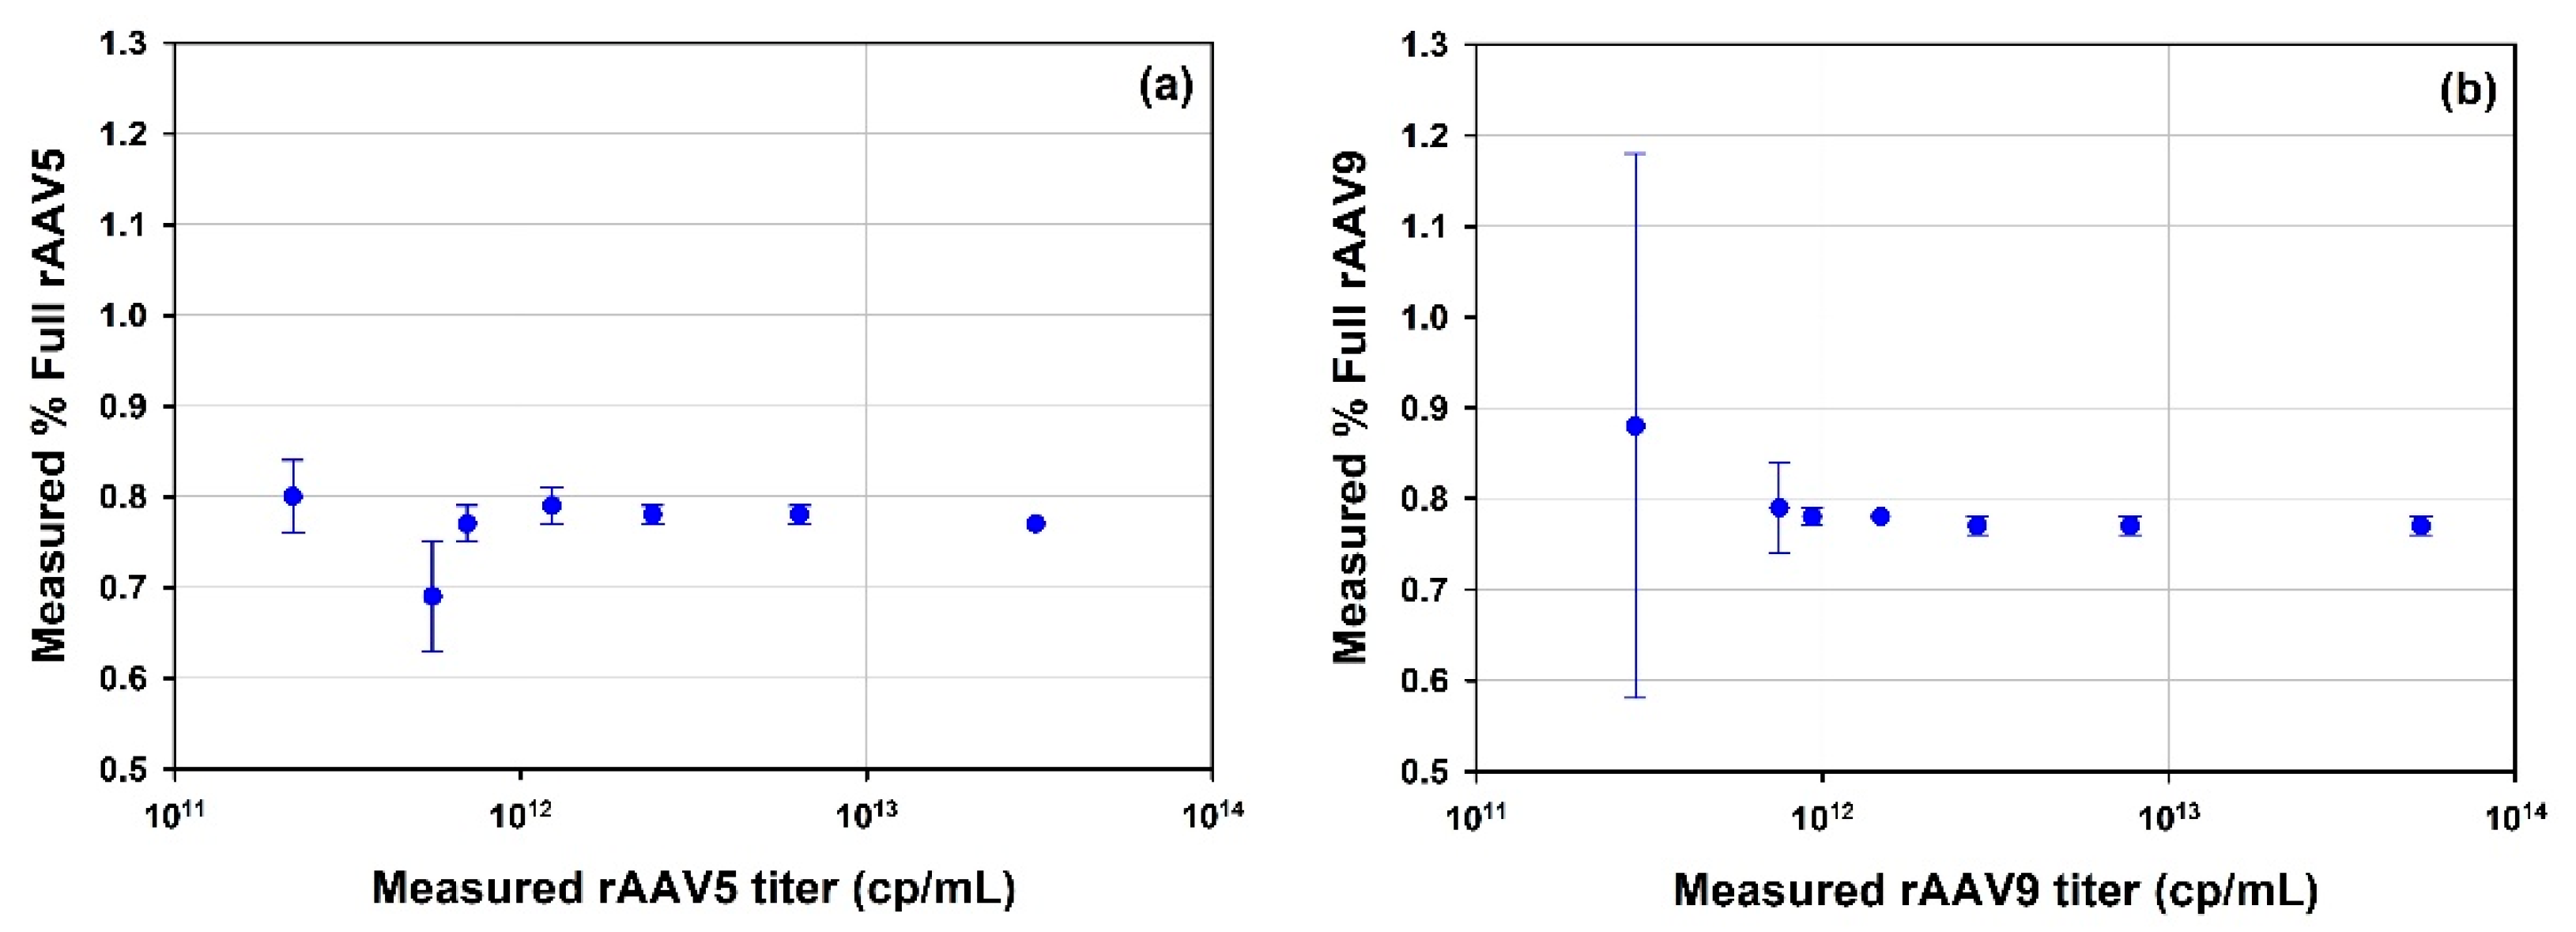
3.3.1. Recombinant Adeno-Associated Viruses
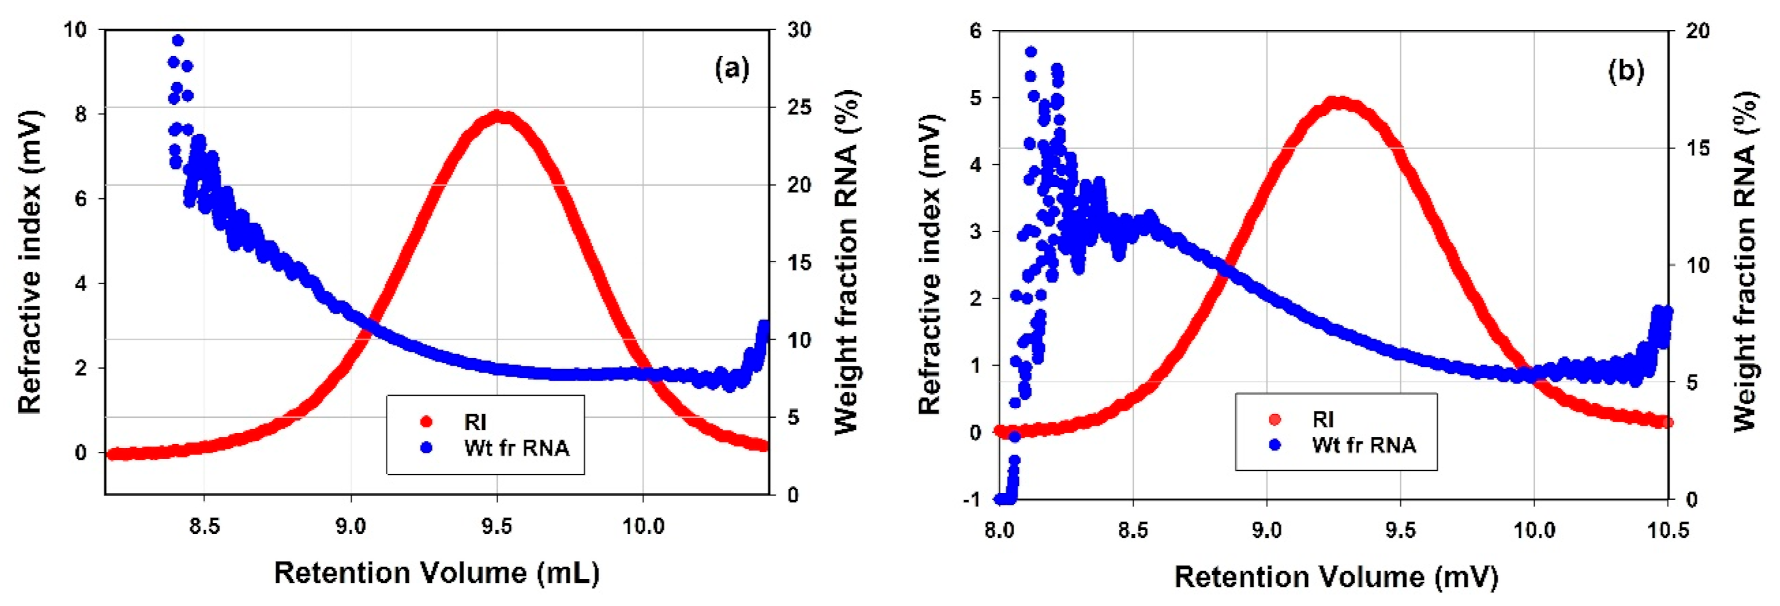
3.3.2. Lipid Nanoparticles
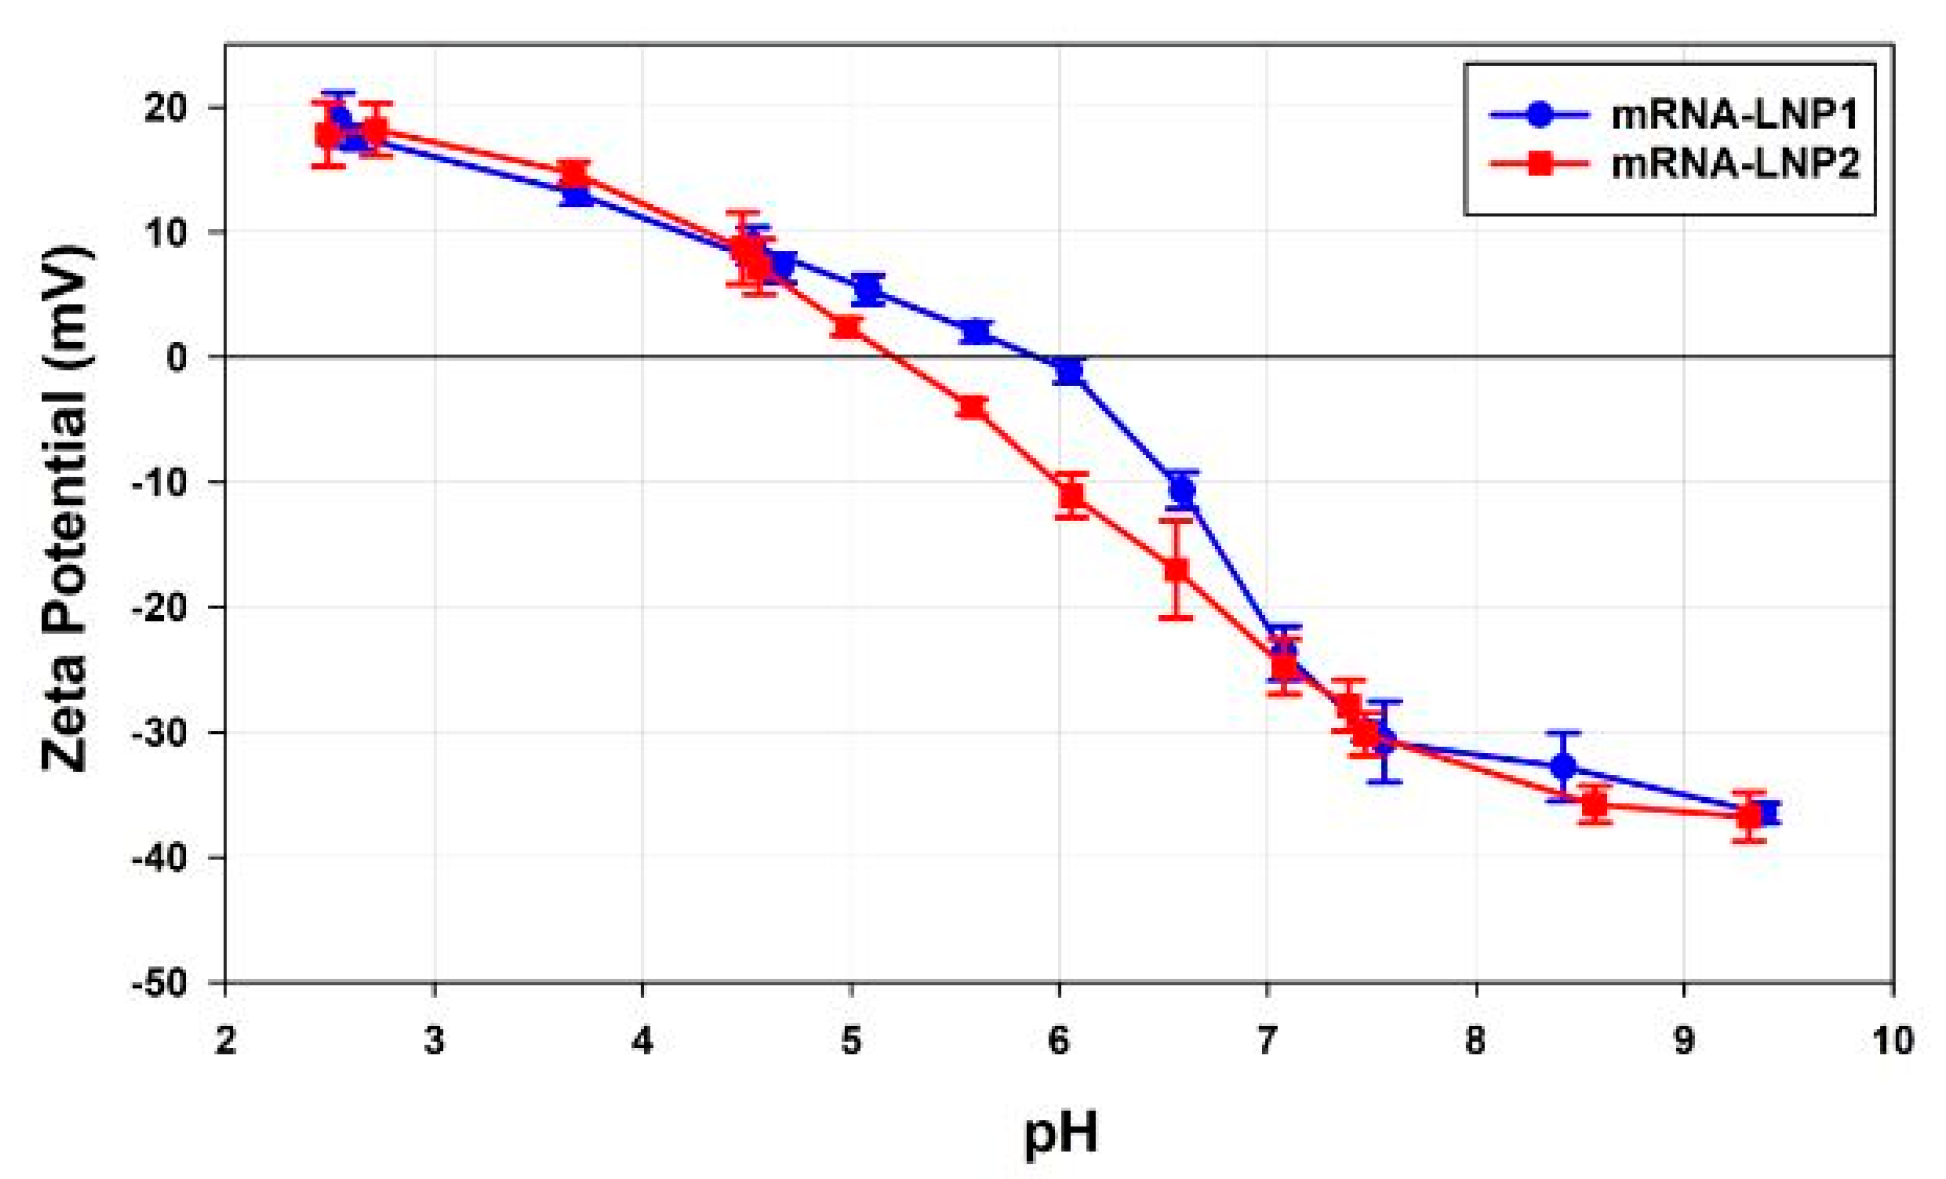
3.4. Electrophoretic Light Scattering
pH Titrations
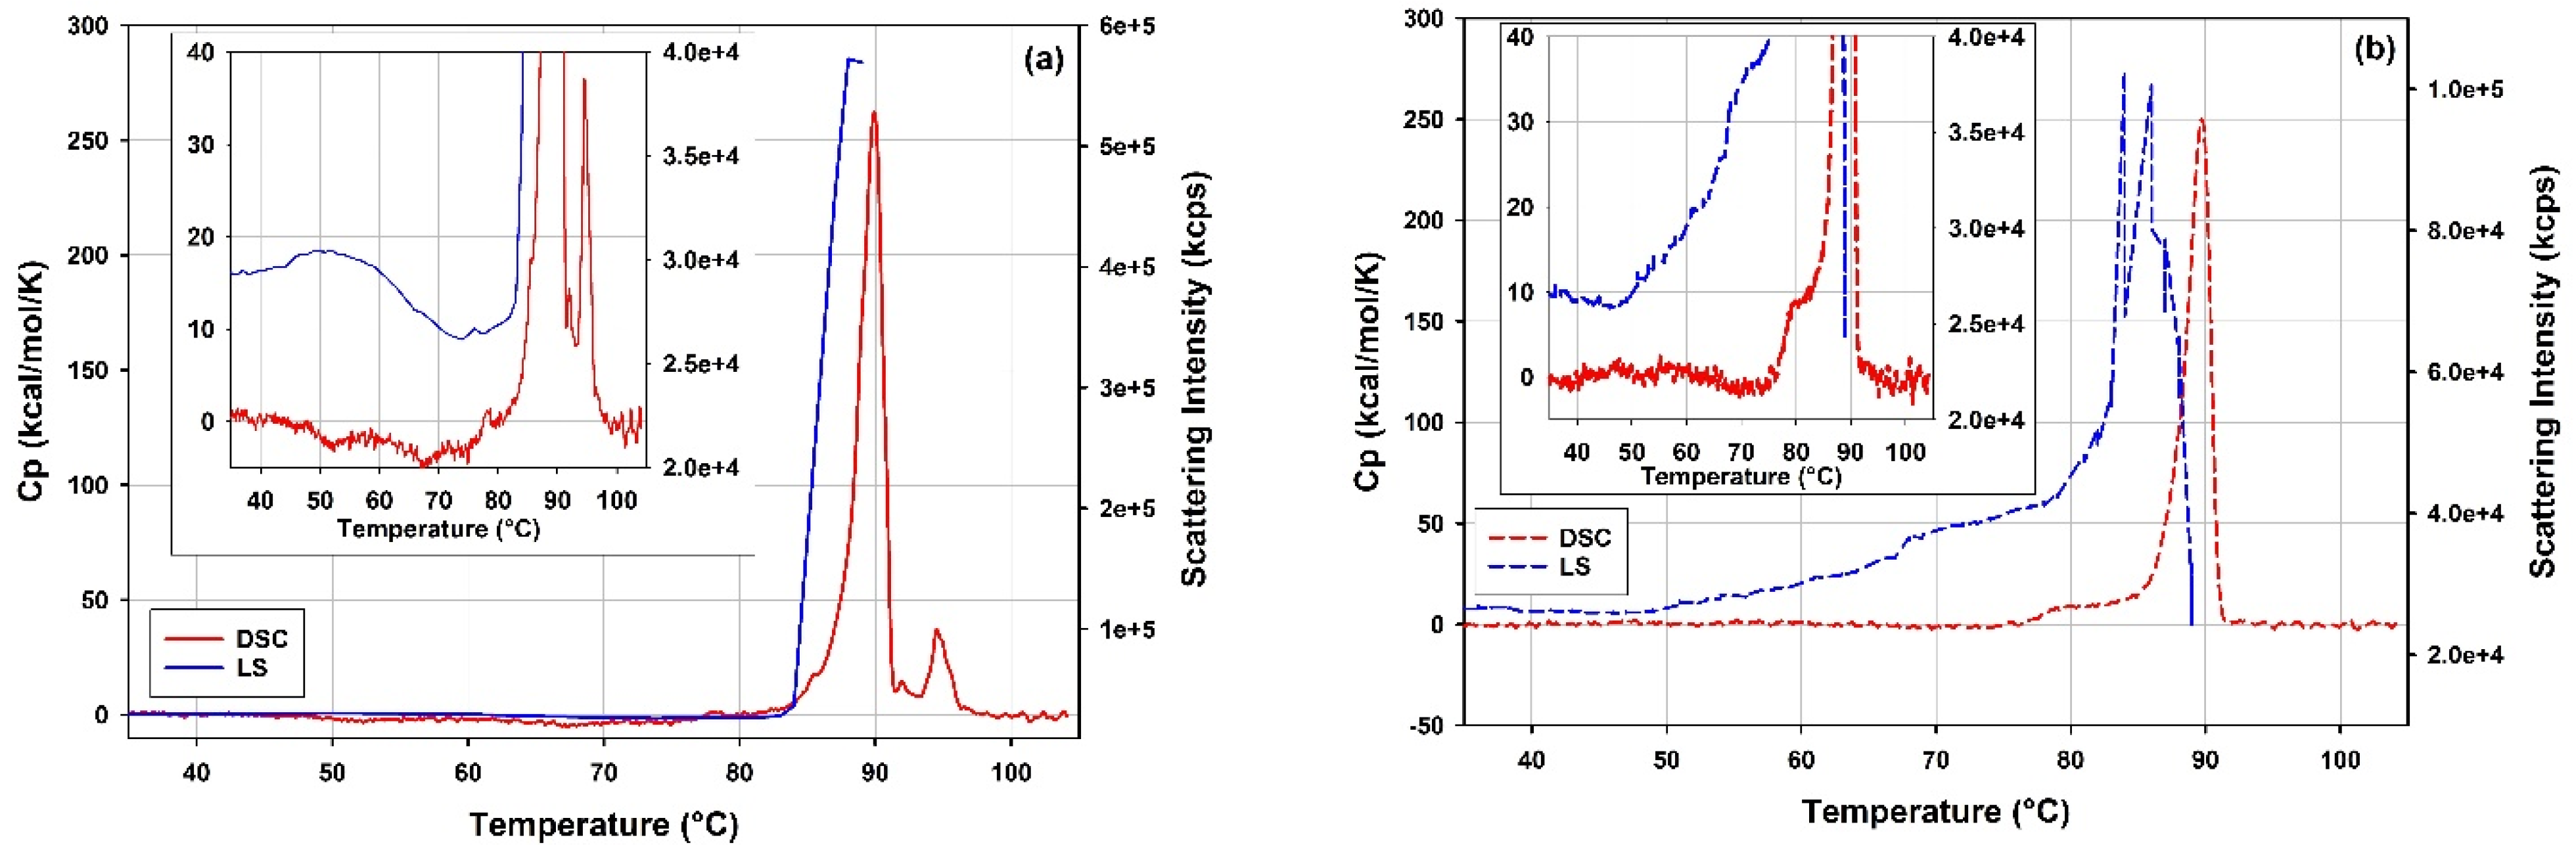
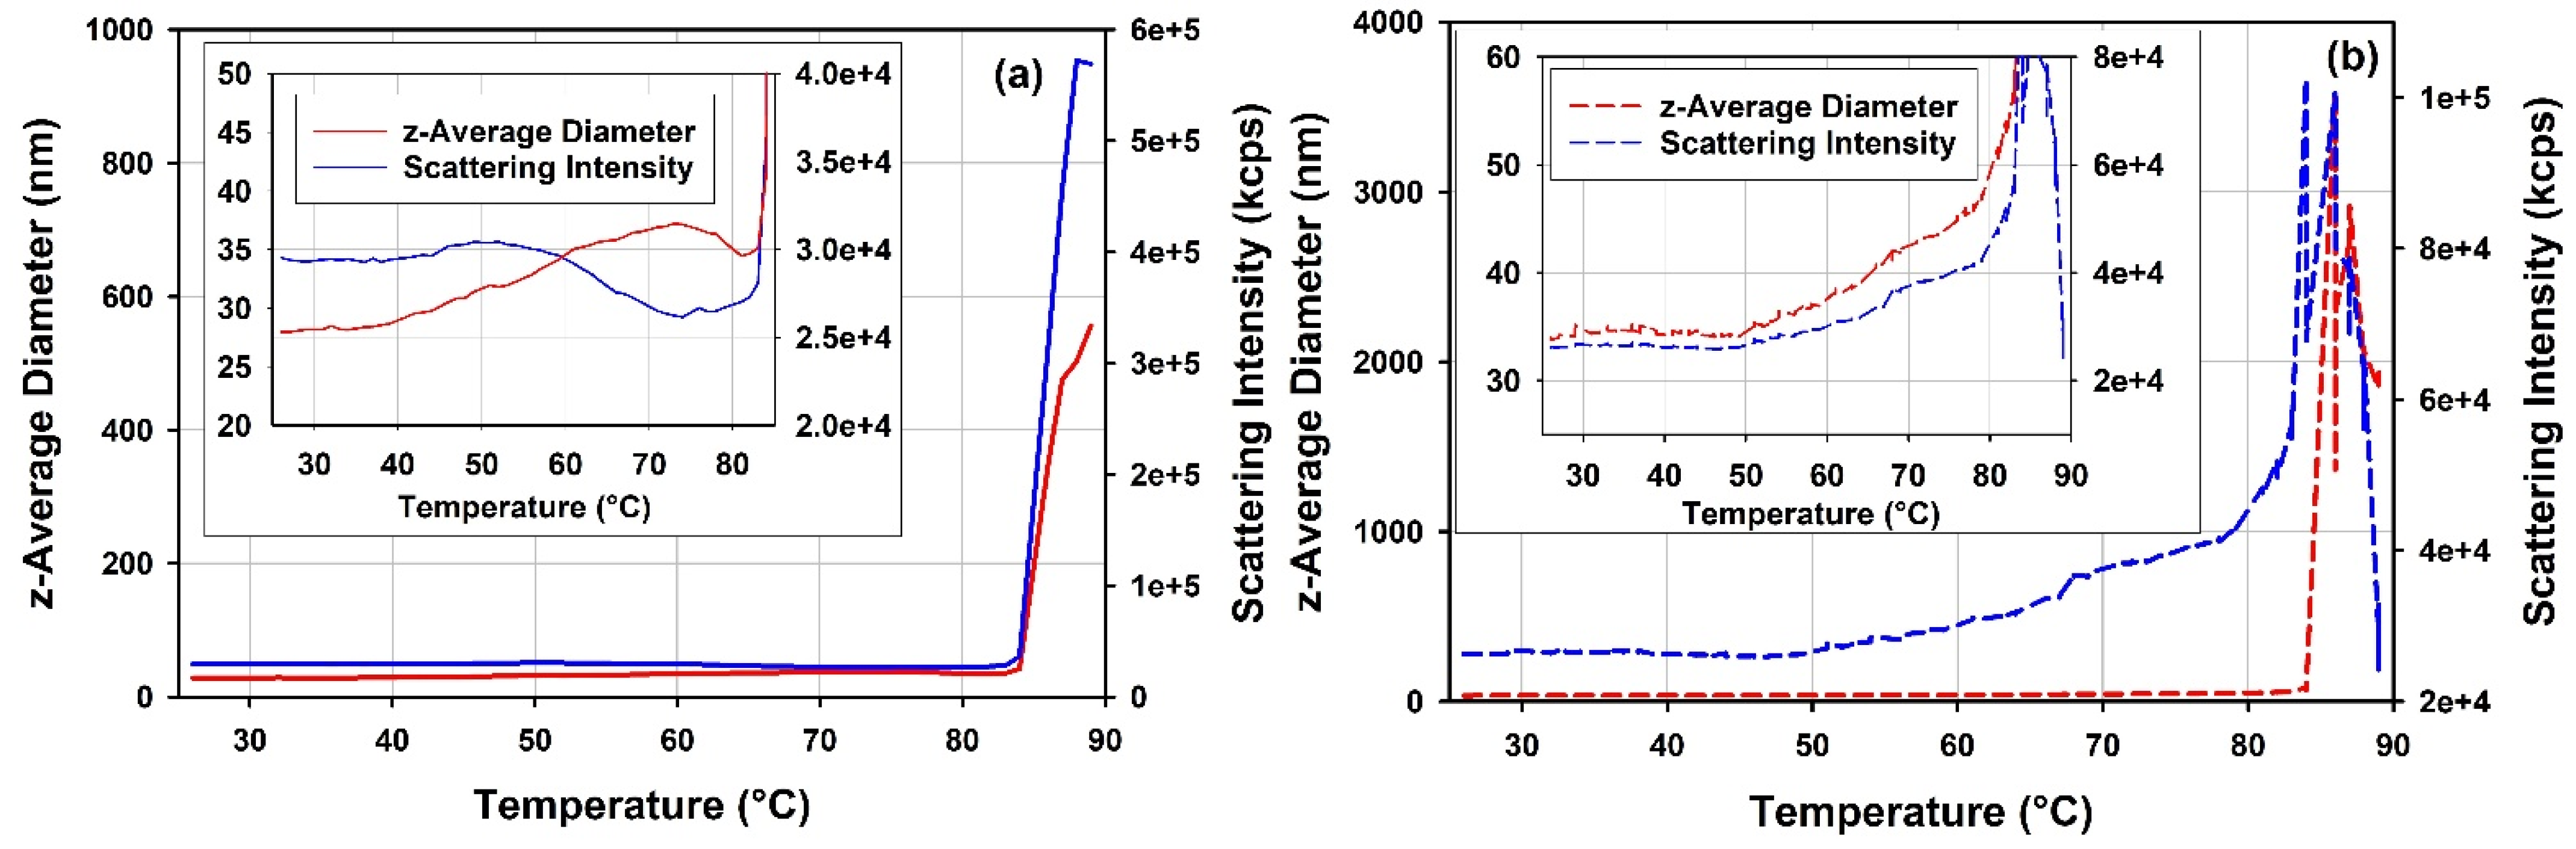
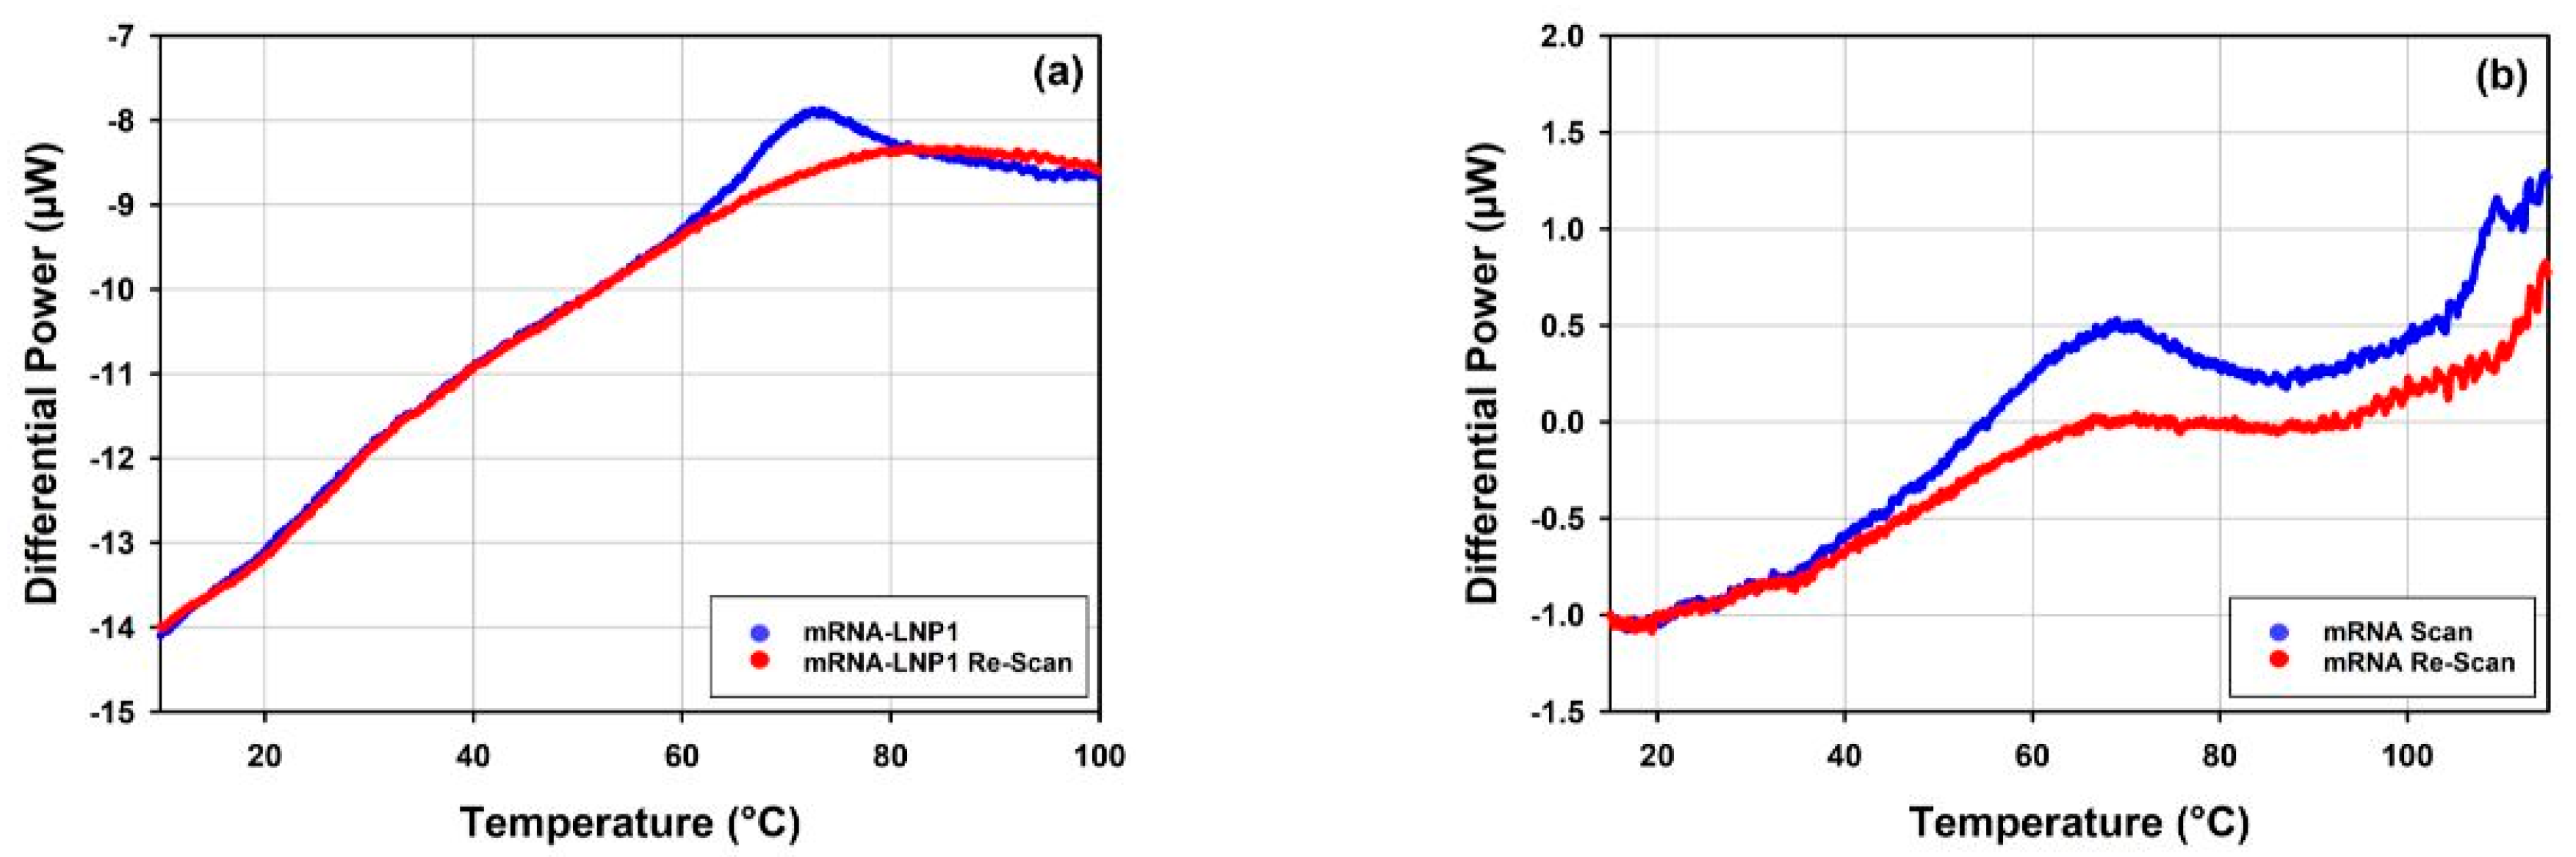
3.5. Thermal Stability by DLS Thermal Ramps and DSC
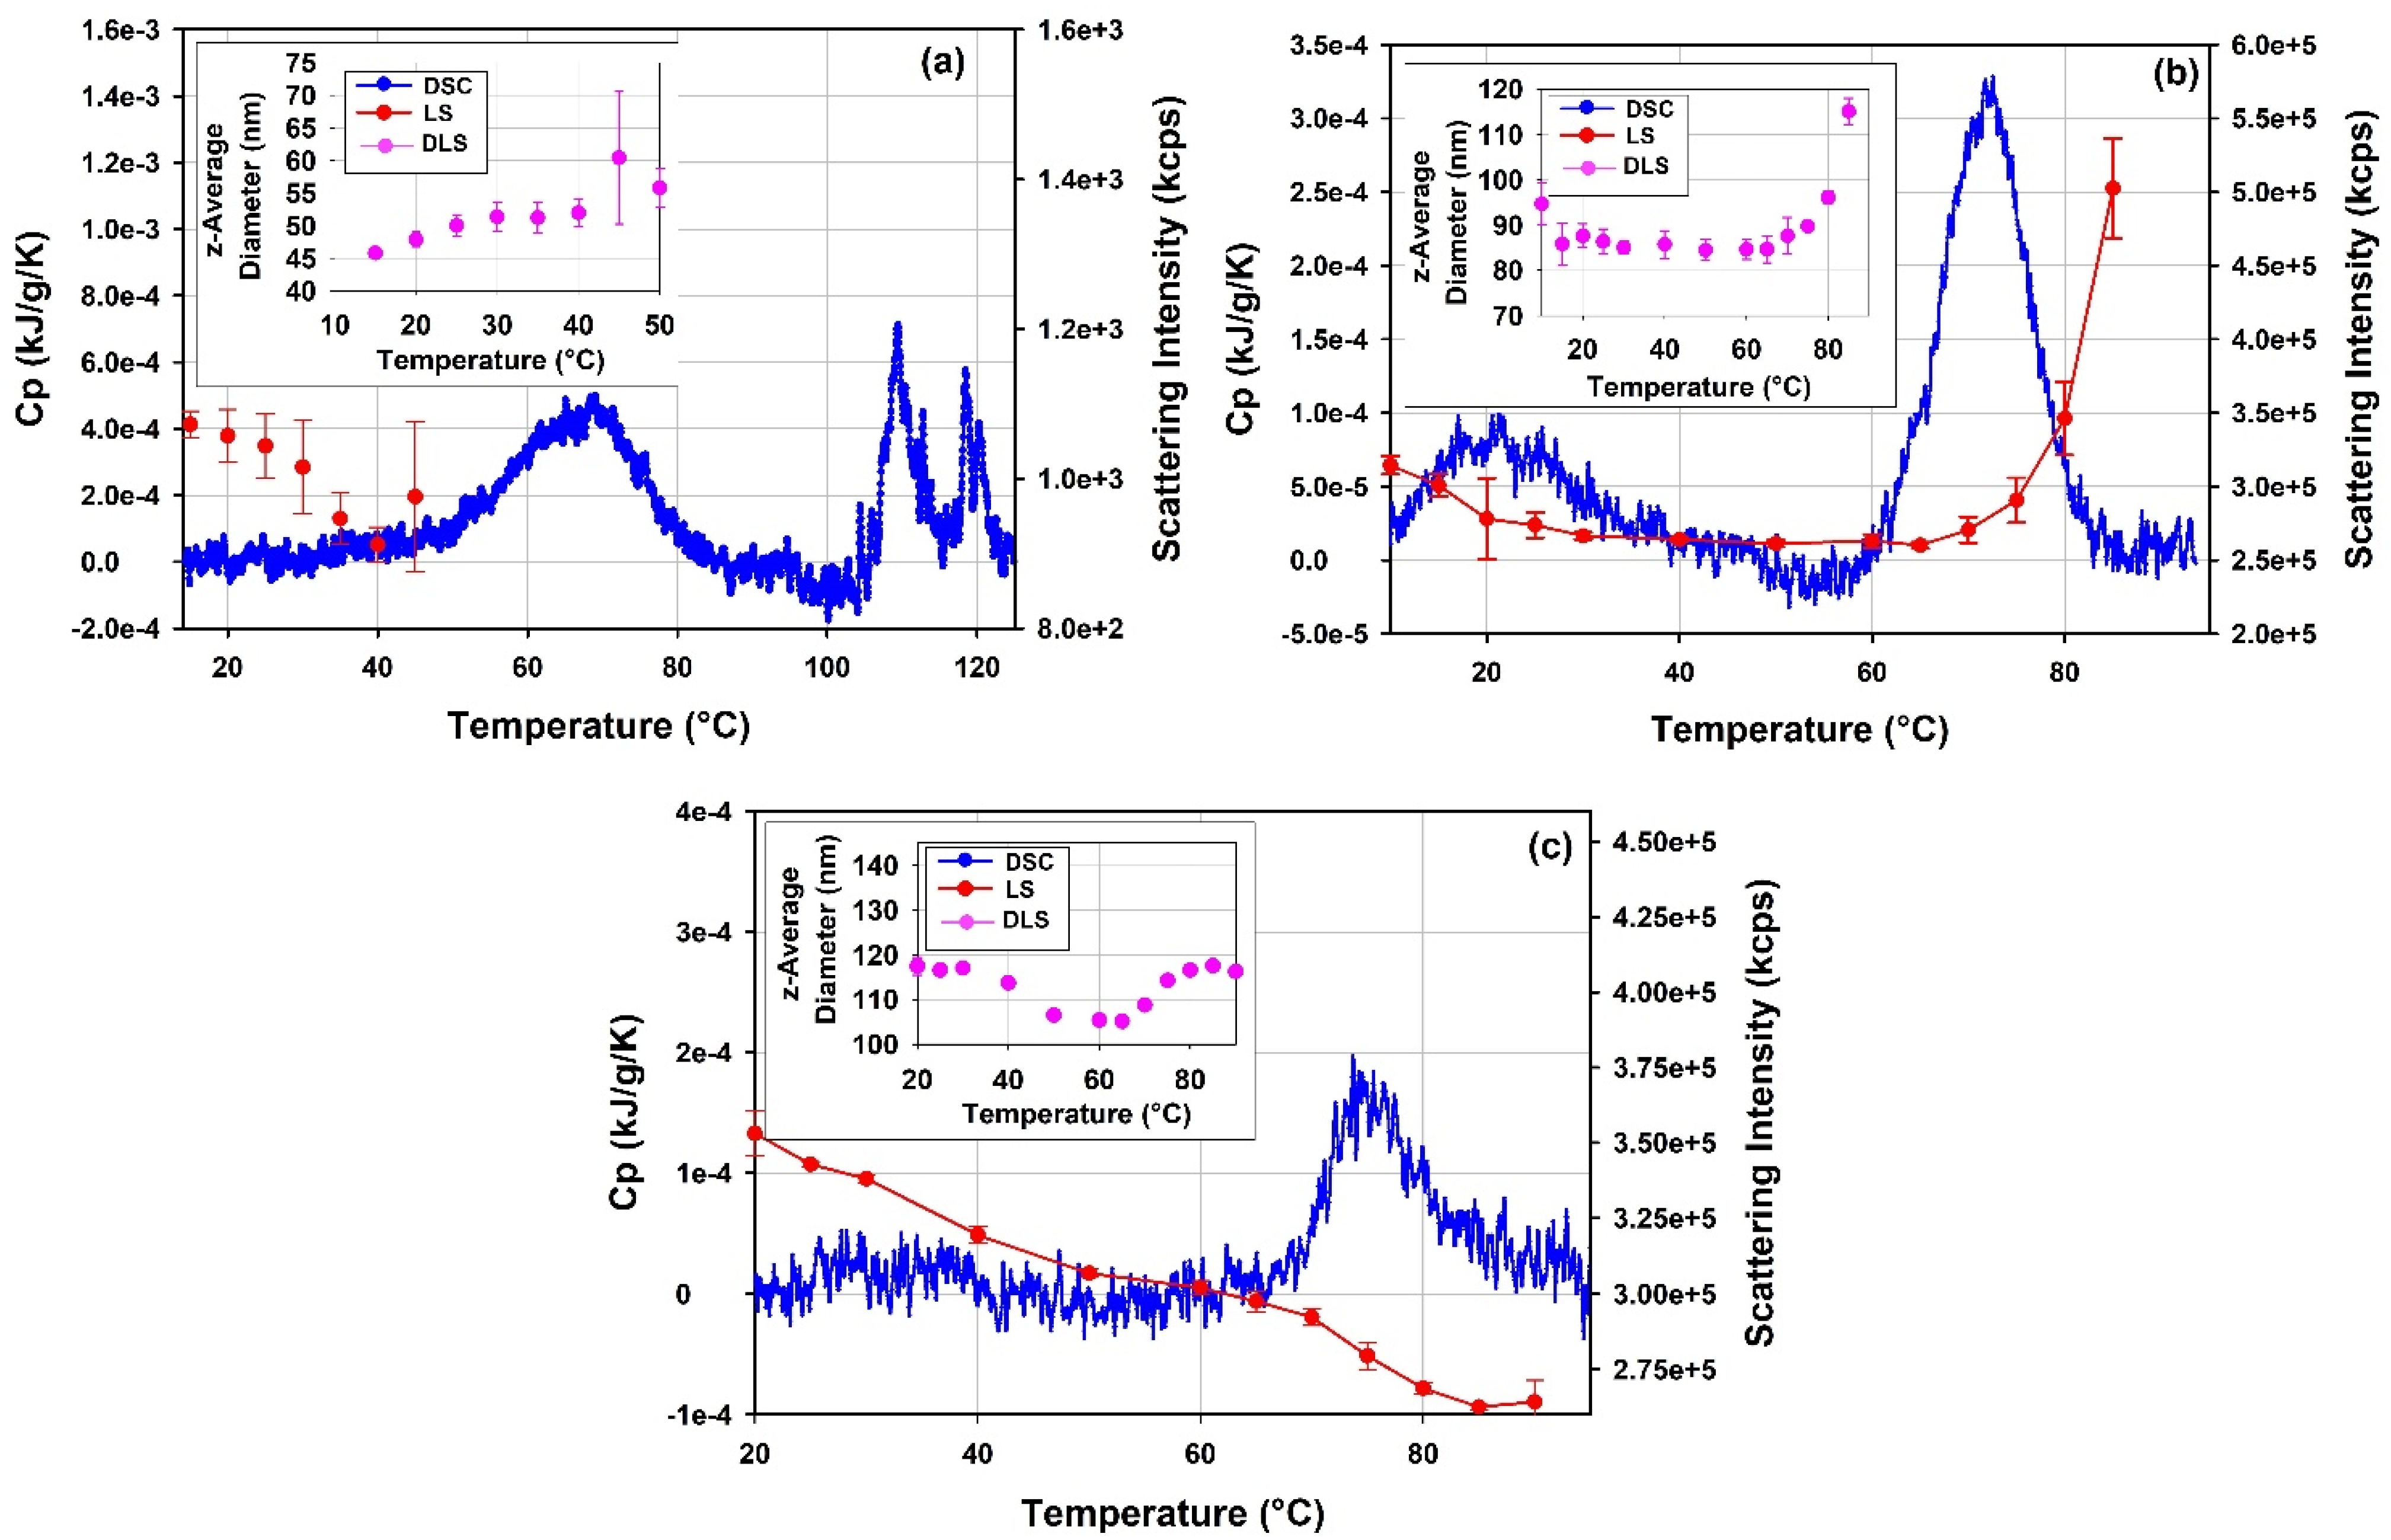
3.5.1. Thermal Stability of rAAV5 by DLS Thermal Ramps and DSC
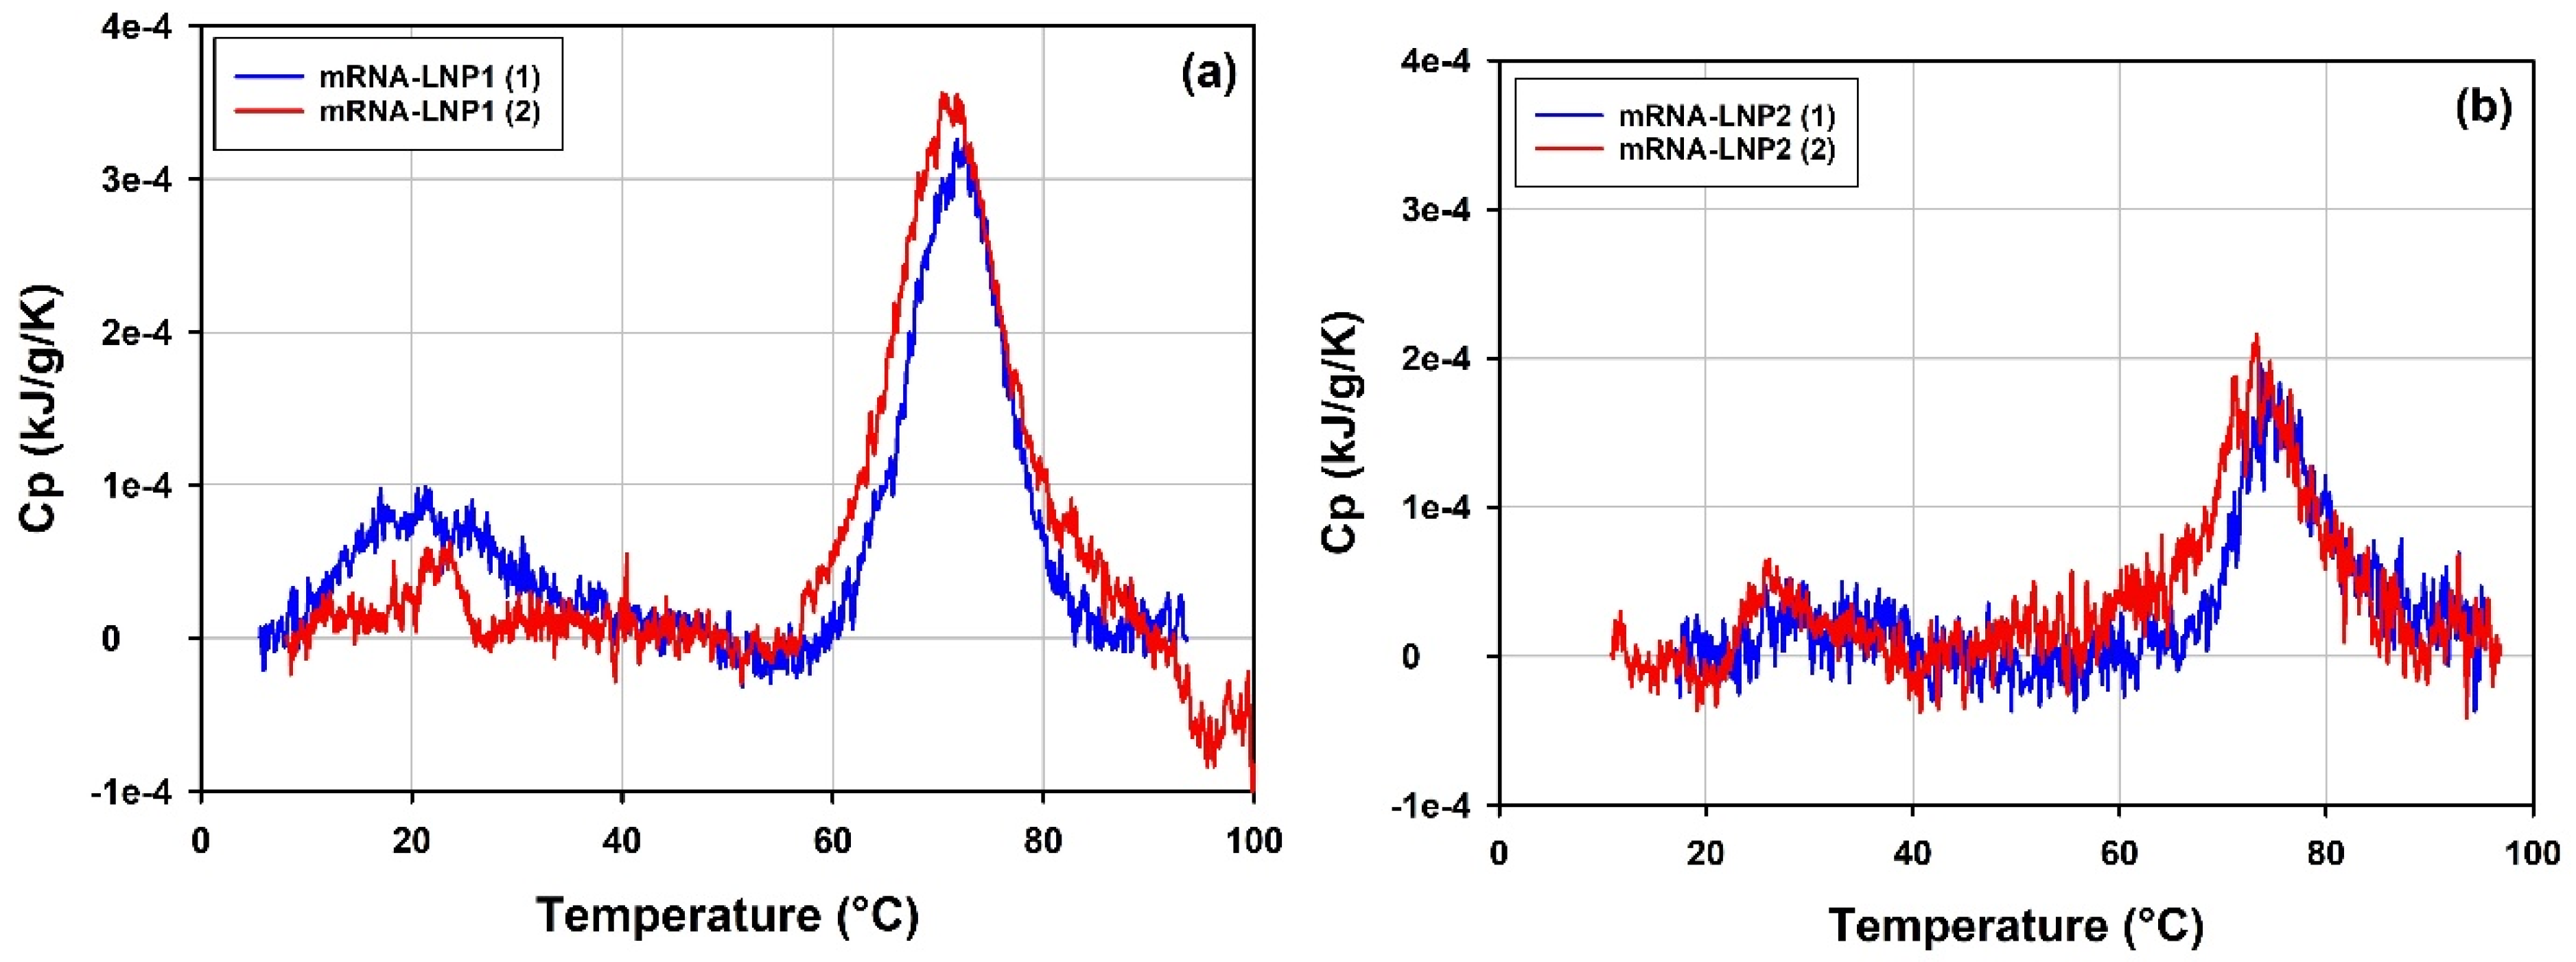
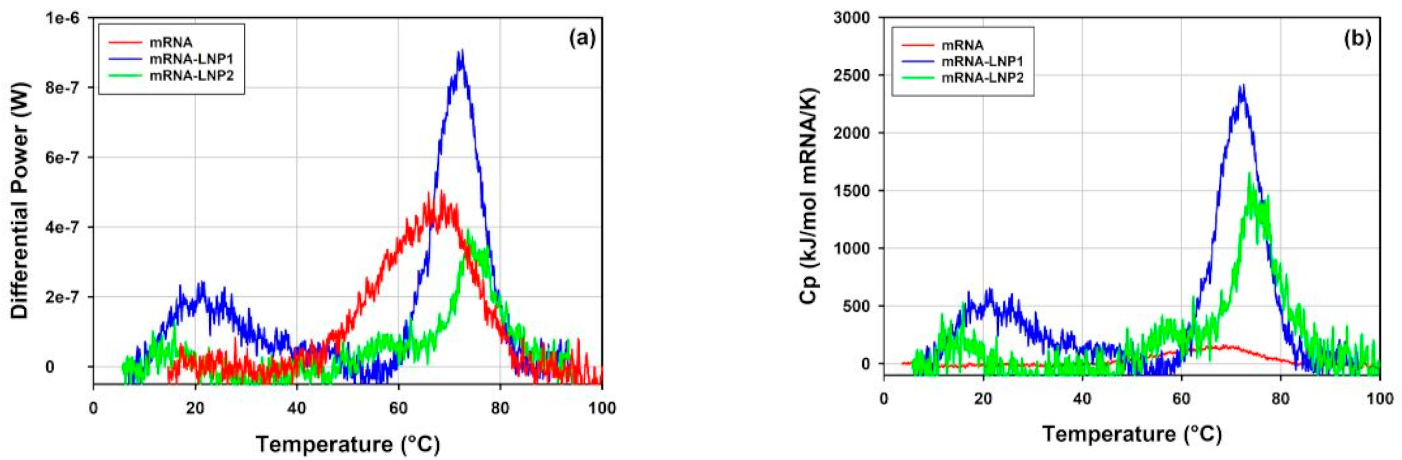
3.5.2. Thermal Stability of mRNA-LNP1 and mRNA-LNP2 by DLS Thermal Ramps and DSC
4. Discussion
4.1. Size Distribution and Sample Polydispersity
4.2. Particle Concentration
4.3. SEC-SLS
4.3.1. AAV
4.3.2. LNPs
4.4. Zeta Potential Discussion
4.5. Thermal Stability by DLS Thermal Ramps and DSC
4.5.1. Thermal Stability of rAAV5
4.5.2. Thermal Stability of mRNA-LNP1 and mRNA-LNP2
5. Conclusions
Author Contributions
Funding
Data Availability Statement
Acknowledgments
Conflicts of Interest
Abbreviations
References
- Sanyal, G.; Särnefält, A.; Kumar, A. Considerations for bioanalytical characterization and batch release of COVID-19 vaccines. Vaccines 2021, 6, 53. [Google Scholar] [CrossRef] [PubMed]
- Baldwin, J.; Piplani, S.; Sakala, I.G.; Honda-Okubo, Y.; Li, L.; Petrovsky, N. Rapid development of analytical methods for evaluating pandemic vaccines: A COVID-19 perspective. Bioanalysis 2021, 13, 1805–1826. [Google Scholar] [CrossRef]
- Halamoda-Kenzaoui, B.; Vandebriel, R.; Howarth, A.; Siccardi, M.; David, C.; Liptrott, N.; Santin, M.; Borgos, S.; Bremer-Hoffmann, S.; Caputo, F. Methodological needs in the quality and safety characterisation of nanotechnology-based health products: Priorities for method development and standardization. J. Control. Release 2021, 336, 192–206. [Google Scholar] [CrossRef] [PubMed]
- Nanomaterials. Guidance for Industry. Available online: https://www.fda.gov/media/109910/download (accessed on 31 December 2017).
- Assessment Report. COVID-19 Vaccine Moderna. Available online: https://www.ema.europa.eu/en/documents/assessment-report/spikevax-previously-COVID-19-vaccine-moderna-epar-public-assessment-report_en.pdf (accessed on 11 March 2021).
- Assessment Report. Comirnaty. Available online: https://www.ema.europa.eu/en/documents/assessment-report/comirnaty-epar-public-assessment-report_en.pdf (accessed on 19 February 2021).
- Fan, Y.; Marioli, M.; Zhang, K. Analytical characterization of liposomes and other lipid nanoparticles for drug delivery. J. Pharm. Biomed. Anal. 2021, 192, 113642. [Google Scholar] [CrossRef]
- Caputo, F.; Clogston, J.; Calzolai, L.; Rösslein, M.; Prina-Mello, A. Measuring particle size distribution of nanoparticle enabled medicinal products, the joint view of EUNCL and NCI-NCL. A step by step approach combining orthogonal measurements with increasing complexity. J. Control. Release 2019, 299, 31–43. [Google Scholar] [CrossRef]
- Hassett, K.J.; Higgins, J.; Woods, A.; Levy, B.; Xia, Y.; Hsiao, C.J.; Acosta, E.; Almarsson, Ö.; Moore, M.J.; Brito, L.A. Impact of lipid nanoparticle size on mRNA vaccine immunogenicity. J. Control. Release 2021, 335, 237–246. [Google Scholar] [CrossRef] [PubMed]
- Mildner, R.; Hak, S.; Parot, J.; Hyldbakk, A.; Borgos, S.; Some, D.; Johann, C.; Caputo, F. Improved multidetector asymmetrical-flow field-flow fractionation method for particle sizing and concentration measurements of lipid-based nanocarriers for RNA delivery. Eur. J. Pharm. Biopharm. 2021, 163, 252–265. [Google Scholar] [CrossRef]
- Vogel, R.; Savage, J.; Muzard, J.; Della Camera, G.; Vella, G.; Law, A.; Marchioni, M.; Mehn, D.; Geiss, O.; Peacock, B.; et al. Measuring particle concentration of multimodal synthetic reference materials and extracellular vesicles with orthogonal techniques: Who is up to the challenge? J. Extracell. Vesicles 2021, 10, e12052. [Google Scholar] [CrossRef]
- Michels, A.; Frank, A.M.; Günther, D.M.; Mataei, M.; Börner, K.; Grimm, D.; Hartmann, J.; Buchholz, C.J. Lentiviral and adeno-associated vectors efficiently transduce mouse T lymphocytes when targeted to murine CD8. Mol. Ther. Methods Clin. Dev. 2021, 23, 334–347. [Google Scholar] [CrossRef]
- Terada, T.; Kulkarni, J.A.; Huynh, A.; Chen, S.; Van Der Meel, R.; Tam, Y.Y.C.; Cullis, P.R. Characterization of Lipid Nanoparticles Containing Ionizable Cationic Lipids Using Design-of-Experiments Approach. Langmuir 2021, 37, 1120–1128. [Google Scholar] [CrossRef]
- Hou, X.; Zaks, T.; Langer, R.; Dong, Y. Lipid nanoparticles for mRNA delivery. Nat. Rev. Mater. 2021, 6, 1078–1094. [Google Scholar] [CrossRef]
- Eygeris, Y.; Patel, S.; Jozic, A.; Sahay, G. Deconvoluting Lipid Nanoparticle Structure for Messenger RNA Delivery. Nano Lett. 2020, 20, 4543–4549. [Google Scholar] [CrossRef] [PubMed]
- Brito, L.A.; Chan, M.; Shaw, C.A.; Hekele, A.; Carsillo, T.; Schaefer, M.; Archer, J.; Seubert, A.; Otten, G.R.; Beard, C.W.; et al. A Cationic Nanoemulsion for the Delivery of Next-generation RNA Vaccines. Mol. Ther. 2014, 22, 2118–2129. [Google Scholar] [CrossRef] [Green Version]
- Brader, M.L.; Williams, S.J.; Banks, J.M.; Hui, W.H.; Zhou, Z.H.; Jin, L. Encapsulation state of messenger RNA inside lipid nanoparticles. Biophys. J. 2021, 120, 2766–2770. [Google Scholar] [CrossRef]
- Schoenmaker, L.; Witzigmann, D.; Kulkarni, J.A.; Verbeke, R.; Kersten, G.; Jiskoot, W.; Crommelin, D.J. mRNA-lipid nanoparticle COVID-19 vaccines: Structure and stability. Int. J. Pharm. 2021, 601, 120586. [Google Scholar] [CrossRef] [PubMed]
- Larson, N.R.; Hu, G.; Wei, Y.; Tuesesca, A.; Forrest, M.L.; Middaugh, C.R. pH-Dependent Phase Behavior and Stability of Cationic Lipid–mRNA Nanoparticles. J. Pharm. Sci. 2021. [Google Scholar] [CrossRef]
- Cole, L.; Fernandes, D.; Hussain, M.T.; Kaszuba, M.; Stenson, J.; Markova, N. Characterization of Recombinant Adeno-Associated Viruses (rAAVs) for Gene Therapy Using Orthogonal Techniques. Pharmaceutics 2021, 13, 586. [Google Scholar] [CrossRef] [PubMed]
- Burnham, B.; Nass, S.; Kong, E.; Mattingly, M.; Woodcock, D.; Song, A.; Wadsworth, S.; Cheng, S.H.; Scaria, A.; O’Riordan, C.R. Analytical Ultracentrifugation as an Approach to Characterize Recombinant Adeno-Associated Viral Vectors. Hum. Gene Ther. Methods 2015, 26, 228–242. [Google Scholar] [CrossRef]
- Jia, X.; Liu, Y.; Wagner, A.M.; Chen, M.; Zhao, Y.; Smith, K.J.; Some, D.; Abend, A.M.; Pennington, J. Enabling online determination of the size-dependent RNA content of lipid nanoparticle-based RNA formulations. J. Chromatogr. B 2021, 1186, 123015. [Google Scholar] [CrossRef]
- Varache, M.; Ciancone, M.; Couffin, A.-C. Development and validation of a novel UPLC-ELSD method for the assessment of lipid composition of nanomedicine formulation. Int. J. Pharm. 2019, 566, 11–23. [Google Scholar] [CrossRef] [PubMed]
- Parameters, Methods and Considerations for the Physicochemical Characterization of Liposomal Products. National Characterisation Laboratory. Available online: https://ncl.cancer.gov/sites/default/files/PCC_Liposomes.pdf (accessed on 31 December 2020).
- Carrasco, M.J.; Alishetty, S.; Alameh, M.-G.; Said, H.; Wright, L.; Paige, M.; Soliman, O.; Weissman, D.; Cleveland, T.E.; Grishaev, A.; et al. Ionization and structural properties of mRNA lipid nanoparticles influence expression in intramuscular and intravascular administration. Commun. Biol. 2021, 4, 956. [Google Scholar] [CrossRef]
- Giatrellis, S.; Nikolopoulos, G.; Sideratou, Z.; Nounesis, G. Calorimetric study of the interaction of binary DMTAP/DOTAP cationic liposomes with plasmid DNA. J. Liposome Res. 2009, 19, 220–230. [Google Scholar] [CrossRef]
- Lobo, B.A.; Davisb, A.; Koec, G.; Smith, J.G.; Middaugh, C. Isothermal Titration Calorimetric Analysis of the Interaction between Cationic Lipids and Plasmid DNA. Arch. Biochem. Biophys. 2001, 386, 95–105. [Google Scholar] [CrossRef] [PubMed]
- Kalyanram, P.; Puri, A.; Gupta, A. Thermotropic effects of PEGylated lipids on the stability of HPPH-encapsulated lipid nanoparticles (LNP). J. Therm. Anal. 2021, 1–12. [Google Scholar] [CrossRef] [PubMed]
- Rieser, R.; Penaud-Budloo, M.; Bouzelha, M.; Rossi, A.; Menzen, T.; Biel, M.; Büning, H.; Ayuso, E.; Winter, G.; Michalakis, S. Intrinsic Differential Scanning Fluorimetry for Fast and Easy Identification of Adeno-Associated Virus Serotypes. J. Pharm. Sci. 2020, 109, 854–862. [Google Scholar] [CrossRef] [PubMed] [Green Version]
- International Standard ISO22412. Particle Size Analysis—Dynamic Light Scattering; International Organisation for Standardisation (ISO): Geneva, Switzerland, 2017; Available online: https://www.iso.org/standard/65410.html (accessed on 31 December 2017).
- Dahneke, B.E. (Ed.) Measurement of Suspended Particles by Quasi-Elastic Light Scattering; Wiley: Hoboken, NJ, USA, 1983. [Google Scholar]
- Berne, B.J.; Pecora, R. Dynamic Light Scattering with Applications to Biology, Chemistry and Physics; Dover Publications: Mineola, NY, USA, 2000. [Google Scholar]
- Washington, C. Particle Size Analysis in Pharmaceutics and Other Industries: Theory and Practice; Jenny Stanford Publishing: Singapore, 1992. [Google Scholar]
- Mie, G. Contributions to the Optics of Diffusing Media. Ann. Physik. 1908, 25, 377–382. [Google Scholar] [CrossRef]
- Malvern Panalytical. Better DLS Data with Less Time and Effort. Available online: https://www.malvernpanalytical.com/en/learn/knowledge-center/application-notes/AN180430IntroAdaptiveCorrelation.html (accessed on 31 December 2019).
- Malvern Panalytical. Measuring the Concentration of Adeno Associated Virus with Multi-Angle Dynamic Light Scattering (MADLS). Available online: https://www.malvernpanalytical.com/en/learn/knowledge-center/application-notes/AN180608AdenoVirusConcentrationMADLS.html (accessed on 31 December 2019).
- Malvern Panalytical. Multi-Angle Dynamic Light Scattering (MADLS) on the Zetasizer Ultra—How It Works. Available online: https://www.malvernpanalytical.com/en/learn/knowledge-center/technical-notes/TN180719HowItWorksMADLS.html (accessed on 31 December 2019).
- Austin, J.; Minelli, C.; Hamilton, D.; Wywijas, M.; Jones, H.J. Nanoparticle number concentration measurements by multi-angle dynamic light scattering. J. Nanopart. Res. 2020, 22, 108. [Google Scholar] [CrossRef]
- Delgado, A.; Caballero, F.G.; Hunter, R.J.; Koopal, L.; Lyklema, J. Measurement and Interpretation of Electrokinetic Phenomena (IUPAC Technical Report). Pure Appl. Chem. 2005, 77, 1753–1805. [Google Scholar] [CrossRef] [Green Version]
- International Standard ISO13099-2: Colloidal Systems—Methods for Zeta Potential Determination—Part 2: Optical Methods; International Organisation for Standardisation (ISO): Geneva, Switzerland, 2012; Available online: https://www.iso.org/standard/52832.html (accessed on 30 June 2012).
- Hunter, R.J. Zeta Potential in Colloid Science: Principles and Applications; Academic Press: London, UK, 1988. [Google Scholar]
- Corbett, J.C.W.; Jack, R.O. Measuring Protein Mobility Using Modern Microelectrophoresis. Colloids Surf. A Physicochem. Eng. Aspects 2011, 376, 31–41. [Google Scholar] [CrossRef]
- Allen, T.M.; Hansen, C. Pharmacokinetics of Stealth Versus Conventional Liposomes: Effect of Dose. Biochim. Biophys. Acta 1991, 1068, 133–141. [Google Scholar] [CrossRef]
- Johnson, C.M. Differential scanning calorimetry as a tool for protein folding and stability. Arch. Biochem. Biophys. 2013, 531, 100–109. [Google Scholar] [CrossRef] [PubMed]
- Mabrey, S.; Sturtevant, J. Investigation of phase transitions of lipids and lipid mixtures by high sensitivity differential scanning calorimetry. Proc. Natl. Acad. Sci. USA 1976, 73, 3862–3866. [Google Scholar] [CrossRef] [PubMed] [Green Version]
- Draper, D.E. Strategies for RNA folding. TIBS 1996, 21, 145–149. [Google Scholar] [CrossRef]
- Blake, R.D.; Delcourt, S.G.; Breslauer, K.J. High-resolution calorimetric and optical melting profiles of DNA plasmids: Resolving contributions from intrinsic melting domains and specifically designed inserts. Biopolymer 1999, 50, 303–318. [Google Scholar] [CrossRef]
- Spink, C.H. Differential Scanning Calorimetry. Methods Cell Biol. 2008, 84, 115–141. [Google Scholar] [PubMed]
- Manin, C.; Krell, T.; Nicolaï, M.-C.; Pierre-Justin, C.; Bérard, Y.; Brass, O.; Gérentes, L.; Leung-Tack, P.; Chevalier, M. Characterization of different strains of poliovirus and influenza virus by differential scanning calorimetry. Biotechnol. Appl. Biochem. 2005, 41, 241–246. [Google Scholar] [CrossRef]
- Toinon, A.; Greco, F.; Moreno, N.; Nicolai, M.C.; Guinet-Morlot, F.; Manin, C.; Ronzon, F. Study of rabies virus by Differential Scanning Calorimetry. Biochem. Biophys. Rep. 2015, 4, 329–336. [Google Scholar] [CrossRef] [PubMed] [Green Version]
- Zhang, X.; Wei, M.; Pan, H.; Lin, Z.; Wang, K.; Weng, Z. Robust manufacturing and comprehensive characterization of recombinant hepatitis E virus-like particles in Hecolin(®). Vaccine 2014, 32, 4039–4050. [Google Scholar] [CrossRef] [PubMed]
- Shank-Retzlaff, M.L.; Zhao, Q.; Anderson, C.; Hamm, M.; High, K.; Nguyen, M.; Wang, F.; Wang, N.; Wang, B.; Wang, Y.; et al. Evaluation of the Thermal Stability of Gardasil®. Hum. Vaccines 2006, 2, 147–154. [Google Scholar] [CrossRef] [PubMed]
- Viswanathan, K.; Gopinath, V.P.; Raj, G.D. Formulation of Newcastle disease virus coupled calcium phosphate nanoparticles: An effective strategy for oculonasal delivery to chicken. Colloids Surf. B Biointerfaces 2014, 116, 9–16. [Google Scholar] [CrossRef]
- LiCalsi, C.; Maniaci, M.J.; Christensen, T.; Phillips, E.; Ward, G.H.; Witham, C. A powder formulation of measles vaccine for aerosol delivery. Vaccine 2001, 19, 2629–2636. [Google Scholar] [CrossRef]
- Wei, X.; Cohena, R.; Barenholza, Y. Insights into composition/structure/function relationships of Doxil® gained from “high-sensitivity” differential scanning calorimetry. Eur. J. Pharm. Biopharm. 2016, 104, 260–270. [Google Scholar] [CrossRef]
- Malvern Panalytical. How to Use GPC/SEC for Compositional Analysis. Available online: https://www.malvernpanalytical.com/en/learn/knowledge-center/application-notes/AN170113CompositionalCopolymer (accessed on 13 January 2017).
- Filipe, V.; Hawe, A.; Jiskoot, W. Critical Evaluation of Nanoparticle Tracking Analysis (NTA) by NanoSight for the Measurement of Nanoparticles and Protein Aggregates. Pharm. Res. 2010, 27, 796–810. [Google Scholar] [CrossRef] [PubMed] [Green Version]
- Standard Test Method for Measuring the Size of Nanoparticles in Aqueous Media Using Dynamic Light Scattering; ASTM E3247-20; J&J Editorial, LLC Publishing: Cary, NC, USA, 2020; Available online: https://www.astm.org/e3247-20.html (accessed on 9 January 2020).
- International Standard ISO 5681: Equipment for Crop Protection. 2020. Available online: https://www.iso.org/standard/72299.html (accessed on 31 December 2020).
- Wilkinson, L.D.; Patchigolla, K. Comparison of Different Size Distributions Using Different Techniques Part. Sci. Technol. 2005, 23, 265–284. [Google Scholar]
- Stepto, R.F.T. Dispersity in polymer science (IUPAC Recommendations 2009). Pure Appl. Chem. 2009, 81, 351–353. [Google Scholar] [CrossRef] [Green Version]
- Shiba, K.; Niidome, T.; Katoh, E.; Xiang, H.; Han, L.; Mori, T.; Katayama, Y. Polydispersity as a Parameter for Indicating the Thermal Stability of Proteins by Dynamic Light Scattering. Anal. Sci. 2010, 26, 659–663. [Google Scholar] [CrossRef] [Green Version]
- Falke, S.; Betzel, C. Dynamic Light Scattering (DLS). In Radiation in Bioanalysis. Bioanalysis (Advanced Materials, Methods, and Devices); Pereira, A., Tavares, P., Limão-Vieira, P., Eds.; Springer: Cham, Switzerland, 2019; Volume 8. [Google Scholar] [CrossRef]
- Bennett, A.; Patel, S.; Mietzsch, M.; Jose, A.; Lins-Austin, B.; Yu, J.C.; Bothner, B.; McKenna, R.; Agbandje-McKenna, M. Thermal Stability as a Determinant of AAV Serotype Identity. Mol. Ther. Methods Clin. Dev. 2017, 6, 171–182. [Google Scholar] [CrossRef] [PubMed] [Green Version]
- Longmire, M.; Choyke, P.L.; Kobayashi, H. Clearance properties of nano-sized particles and molecules as imaging agents: Considerations and caveats. Nanomedicine 2008, 3, 703–717. [Google Scholar] [CrossRef] [PubMed] [Green Version]
- Zu, H.; Gao, D. Non-viral Vectors in Gene Therapy: Recent Development, Challenges, and Prospects. AAPS J. 2021, 23, 78. [Google Scholar] [CrossRef]
- Gross-Rother, J.; Blech, M.; Preis, E.; Bakowsky, U.; Garidel, P. Particle Detection and Characterization for Biopharmaceutical Applications: Current Principles of Established and Alternative Techniques. Pharmaceutics 2020, 12, 1112. [Google Scholar] [CrossRef] [PubMed]
- Allen, T.M.; Cullis, P.R. Liposomal Drug Delivery Systems: From Concept to Clinical Applications. Adv. Drug Deliv. Rev. 2013, 65, 36–48. [Google Scholar] [CrossRef] [PubMed]
- Arteta, M.Y.; Kjellman, T.; Bartesaghi, S.; Wallin, S.; Wu, X.; Kvist, A.J.; Dabkowska, A.; Székely, N.; Radulescu, A.; Bergenholtz, J.; et al. Successful reprogramming of cellular protein production through mRNA delivered by functionalized lipid nanoparticles. Proc. Natl. Acad. Sci. USA 2018, 115, E3351–E3360. [Google Scholar] [CrossRef] [Green Version]
- Rayaprolu, V.; Kruse, S.; Kant, R.; Venkatakrishnan, B.; Movahed, N.; Brooke, D.; Lins, B.; Bennett, A.; Potter, T.; McKenna, R.; et al. Comparative Analysis of Adeno-Associated Virus Capsid Stability and Dynamics. J. Virol. 2013, 87, 13150–13160. [Google Scholar] [CrossRef] [Green Version]
- Bernaud, J.; Rossi, A.; Fis, A.; Gardette, L.; Aillot, L.; Büning, H.; Castelnovo, M.; Salvetti, A.; Faivre-Moskalenko, C. Characterization of AAV vector particle stability at the single-capsid level. J. Biol. Phys. 2018, 44, 181–194. [Google Scholar] [CrossRef]
- Horowitz, E.D.; Rahman, K.S.; Bower, B.D.; Dismuke, D.J.; Falvo, M.R.; Griffith, J.D.; Harvey, S.C.; Asokan, A. Biophysical and Ultrastructural Characterization of Adeno-Associated Virus Capsid Uncoating and Genome Release. J. Virol. 2013, 87, 2994–3002. [Google Scholar] [CrossRef] [PubMed] [Green Version]
- Ali, S.; Minchey, S.; Janoff, A.; Mayhew, E. A Differential Scanning Calorimetry Study of Phosphocholines Mixed with Paclitaxel and Its Bromoacylated Taxanes. Biophys. J. 2000, 78, 246–256. [Google Scholar] [CrossRef] [Green Version]
- Middaugh, C.R.; Ramsey, J.D. Analysis of cationic lipid—Plasmid DNA complexes. Anal. Chem. 2007, 79, 7240–7248. [Google Scholar]
- Koltover, I.; Salditt, T.; Raedler, J.O.; Sanya, C.R. An Inverted Hexagonal Phase of Cationic Liposome-DNA Complexes Related to DNA Release and Delivery. Science 1998, 281, 78–81. [Google Scholar] [CrossRef] [Green Version]
- Giancola, C. A convenient tool for studying the stability of proteins and nucleic acids. J. Therm. Anal. Calorim. 2007, 91, 79–85. [Google Scholar] [CrossRef] [Green Version]
- Li, S.J.; Marshall, A.G. Multistage unfolding of wheat germ ribosomal 5S RNA analyzed by Differential Scanning Calorimetry. Biochemistry 1985, 24, 4047–4052. [Google Scholar] [CrossRef]


| Property | Relevant Technology | References |
|---|---|---|
| Capsid/particle size | DLS, SEC/AF4-SLS, NTA, cryo-TEM | [7,12,19,20] |
| Capsid titer or particle count | MADLS, SEC/AF4-SLS, NTA | [7,12,20] |
| Fragmentation | SEC/AF4-SLS | |
| Aggregate formation | DLS, MADLS, NTA, TEM, AF4-SLS | [7,12,20] |
| Composition: | ||
| Percentage of genome-containing virus particles/%full analysis | SEC/AF4-SLS, Anion exchange chromatography, analytical ultracentrifugation, native MS, ELISA, qPCR | [7,21] |
| Encapsulation level | LC-UV-Vis, fluorescence assays, gel electrophoresis | [22] |
| Lipid quantification | LC coupled with Charged aerosol detector or Evaporative light scattering detector or MS | [7,12,22,23,24] |
| Charge | ELS | [7,25] |
| Binding interaction | Isothermal titration calorimetry | [26,27] |
| Thermal stability | DSC, DLS thermal ramp, DSF | [20,28,29] |
| Sample | Camera Level | Detection Threshold | Software Version |
|---|---|---|---|
| Values used for LNP1 and LNP2 | 16 | 5 | NTA software version 3.4 |
| Liposomes | 13–16 * | 4–6 * | NTA software version 3.2 |
| Modified Vaccinia Ankara (MVA) | 14 | 5 | NTA software version 3.4 |
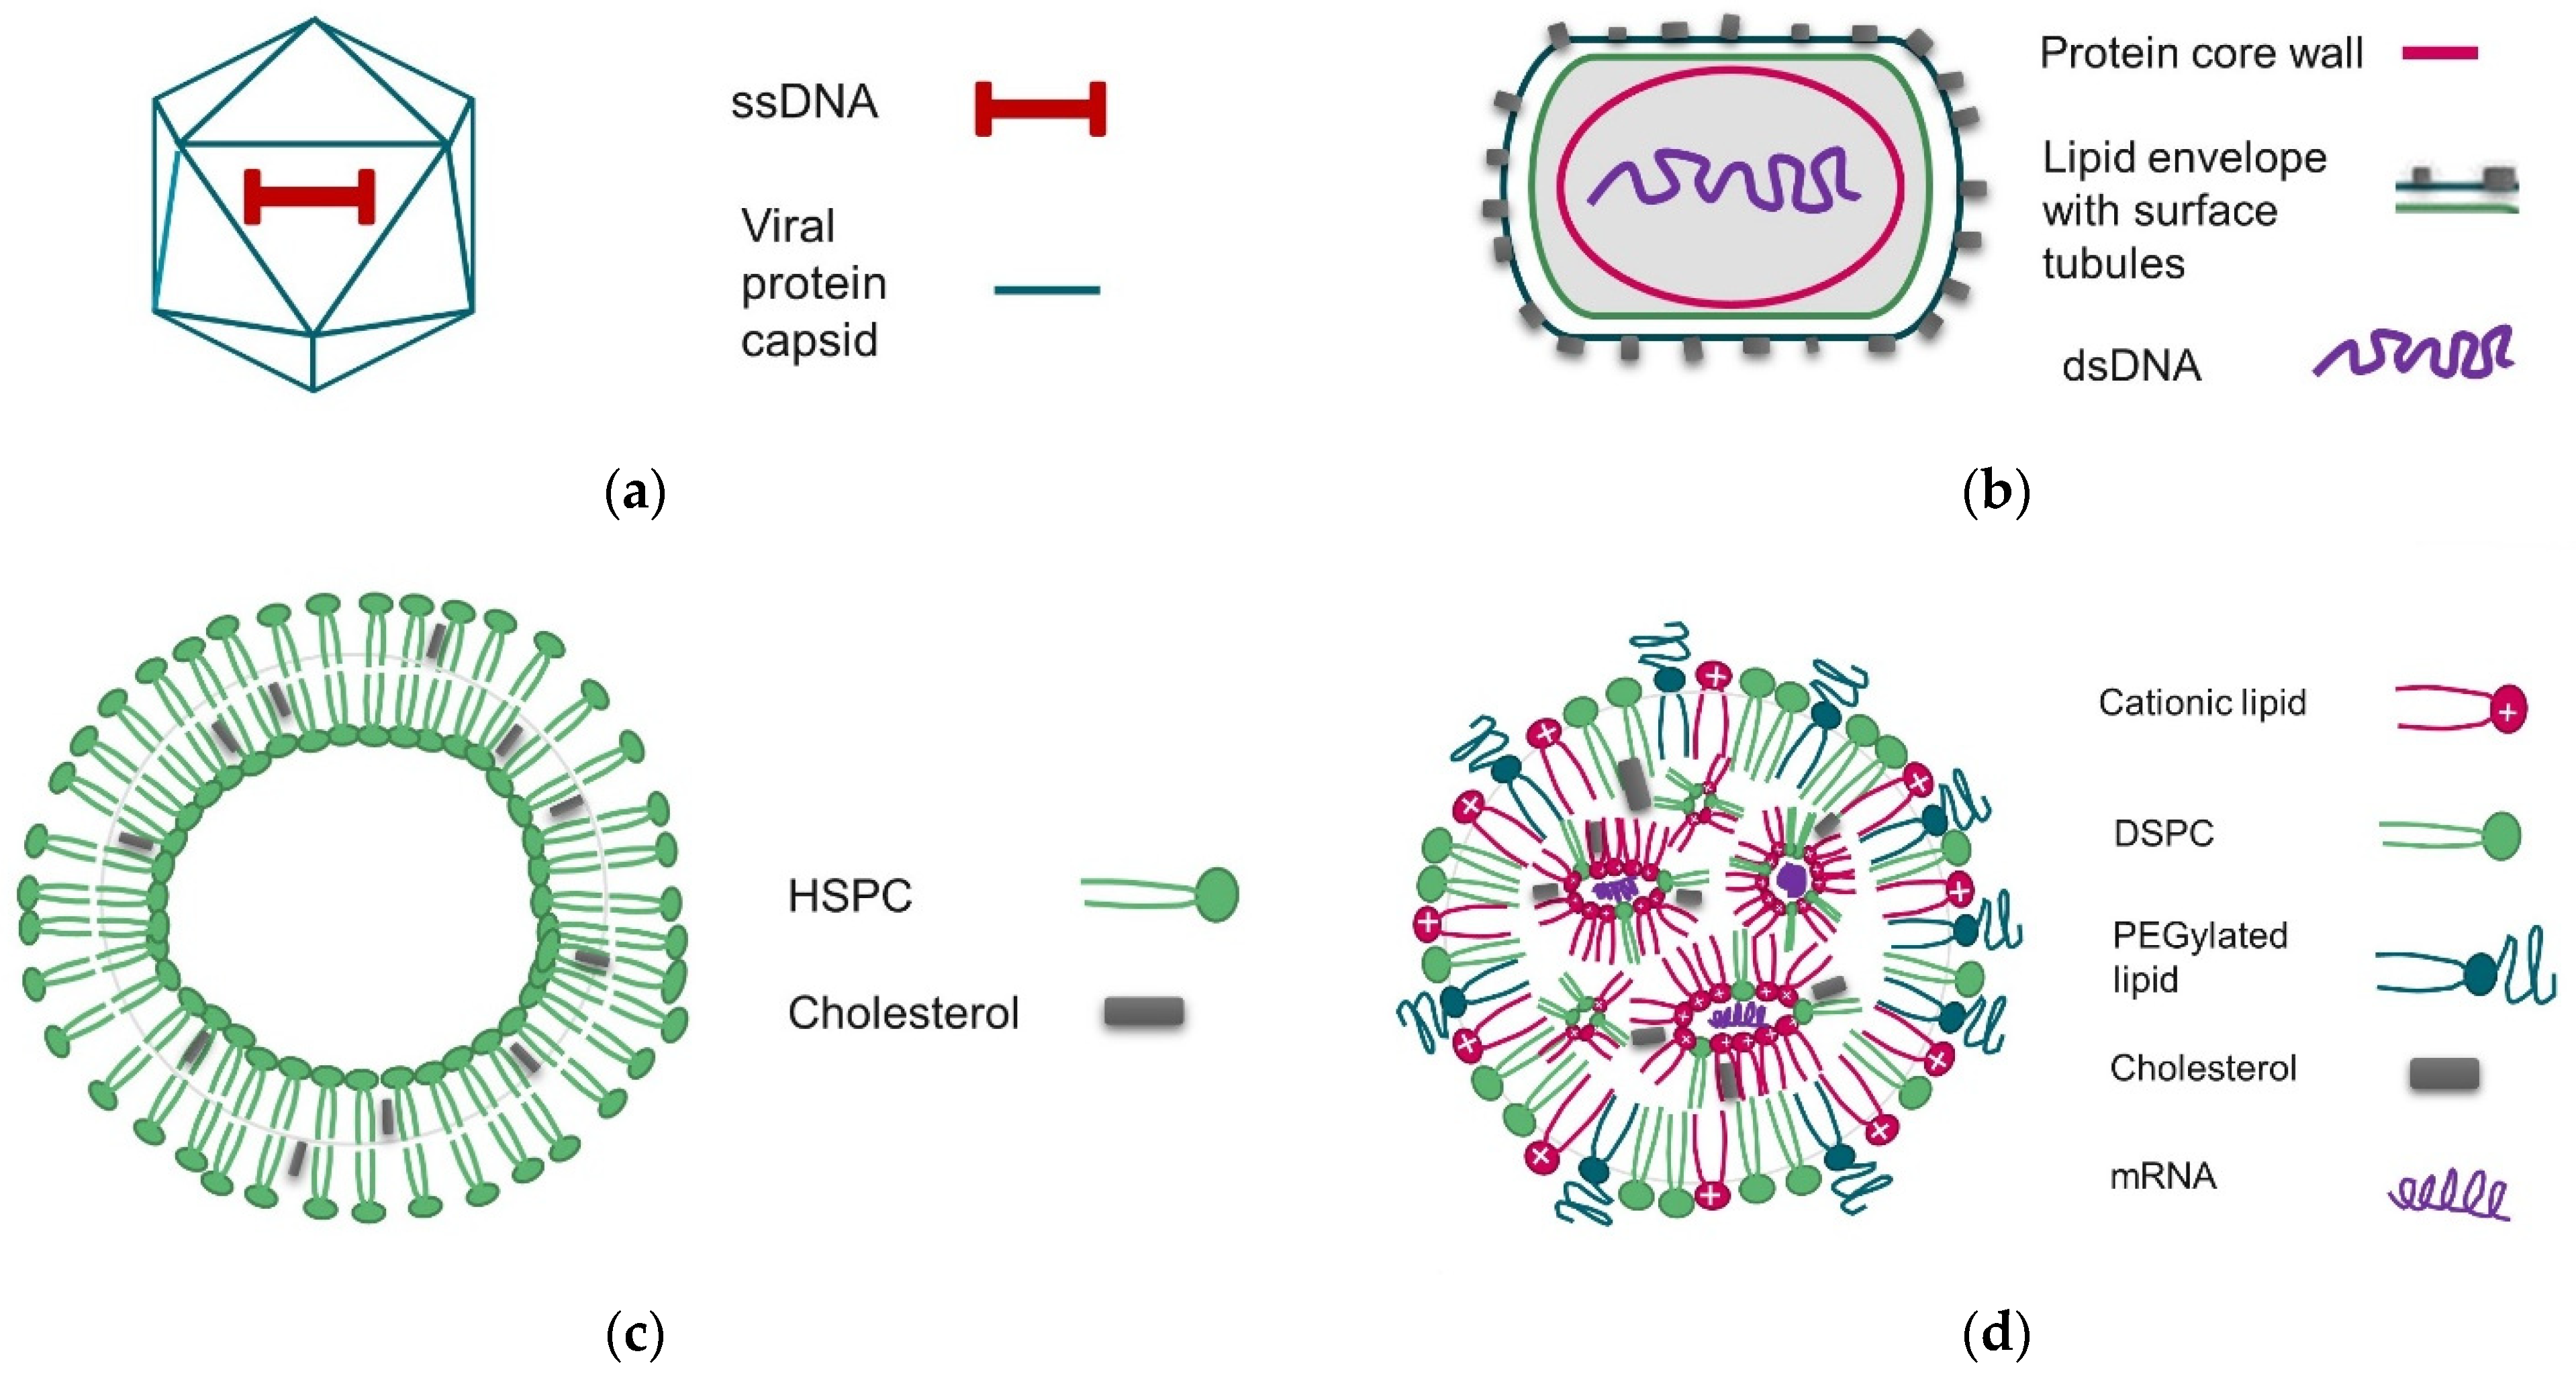
| Delivery Vector | Formulation Description | Payload/Transgene 1 | Expected Size Range, Diameter |
|---|---|---|---|
| Full rAAV5 | Recombinant Adeno-associated virus serotype 5 with transgene | pFB-GFP ssDNA 2544 bases | 25–35 nm |
| Empty rAAV5 | Recombinant Adeno-associated virus serotype 5 without transgene | - | 25–35 nm |
| mRNA-LNP1 | LNP 1 (MC3) 994.4 μg/mL (Total lipid mass) | 0.041 mg/mL Fluc mRNA 1929 bases | 50–120 nm |
| mRNA-LNP2 | LNP2 (SM102) 560.7 μg/mL (Total lipid mass) | 0.026 mg/mL FLuc mRNA 1929 bases | 50–100 nm |
| Liposome | HSPC/CHOL liposomes | - | 60–110 nm |
| MVA | Modified Vaccinia Ankara virus (attenuated) | linear dsDNA ca 180 kbp 2 | 100–400 nm (elongated) |
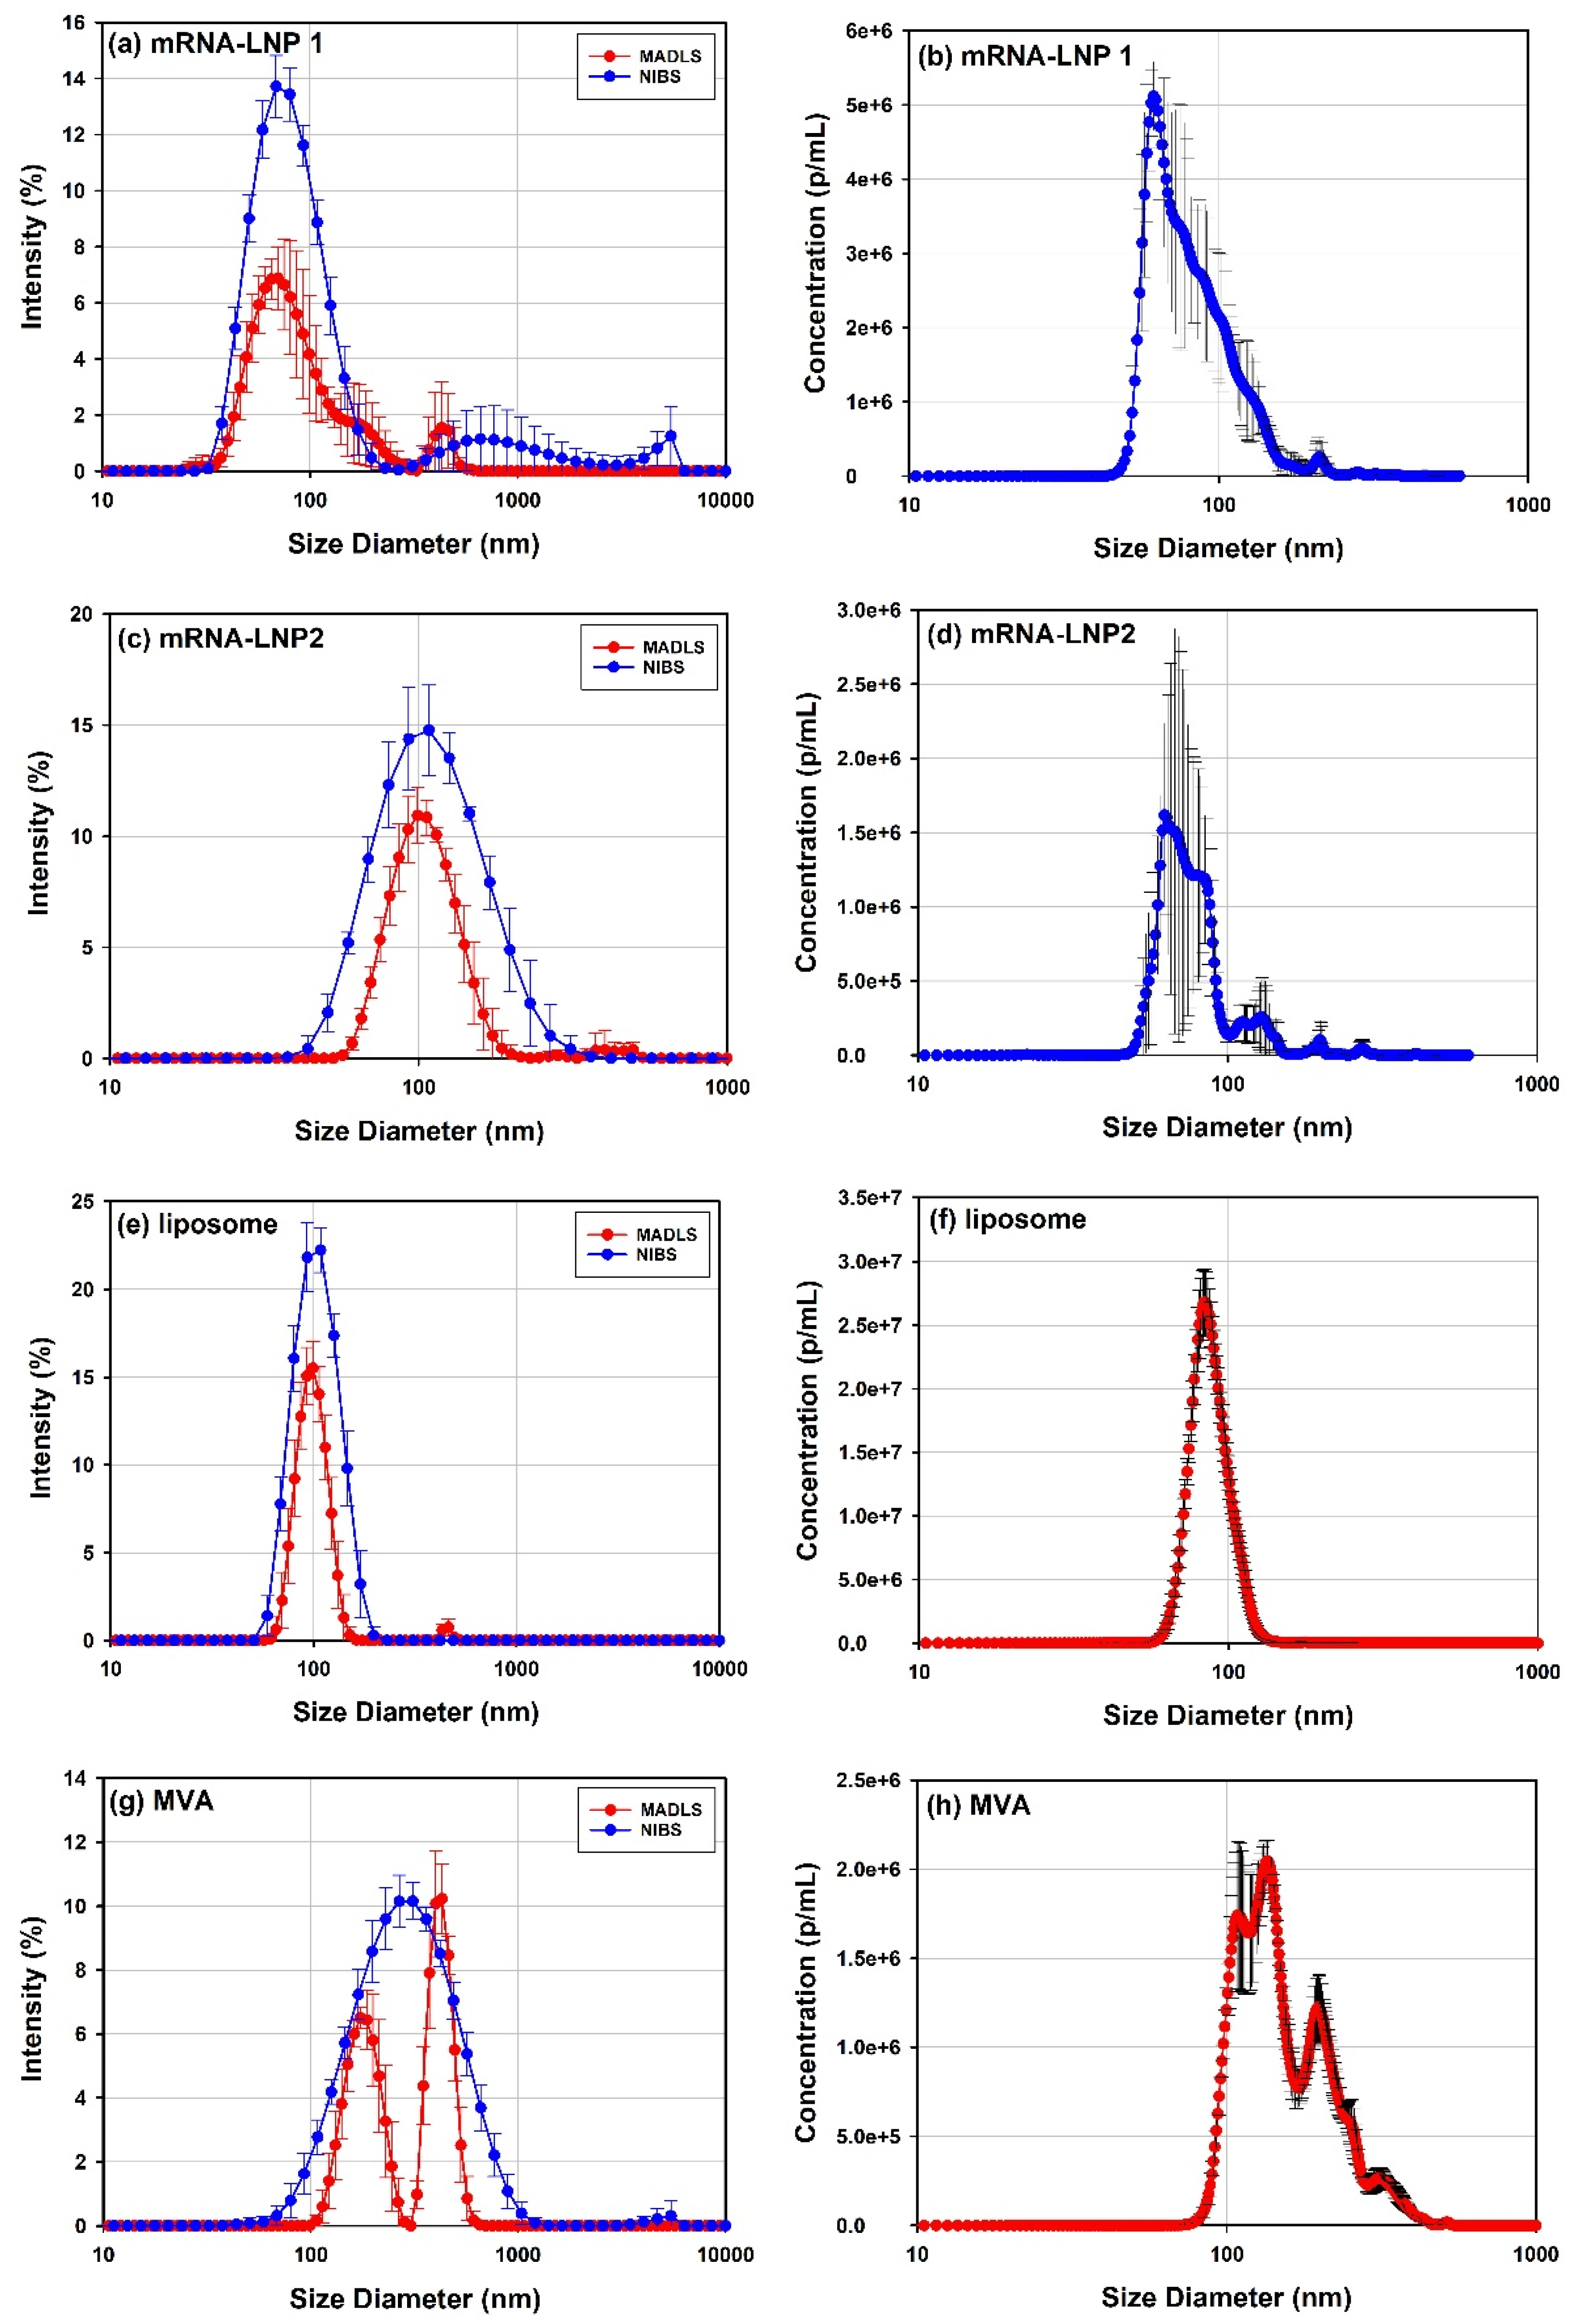
| Sample: (Repeat Measurements per Aliquot) | Z-Average (Cumulants Analysis, nm) | Peak 1 mean (NNLS analysis, nm) | Peak 2 Mean (NNLS Analysis, nm) | Peak 1 Mean (MADLS Analysis, nm) | Peak 2 Mean (MADLS Analysis, nm) | Size Distribution Mode (NTA, nm) | Size Distribution Mean (NTA, nm) |
|---|---|---|---|---|---|---|---|
| LNP 1 (5) | 87.1 ± 5.5 (6.3%) | 81.7 ± 2.9 (3.5%) | 1930 ± 1922 (99.5%) | 75.0 ± 6.8 (9.1%) | 246 ± 179 (73%) | 64 ± 6 (10%) | 95 ± 2 (2.1%) |
| LNP 2 (5) | 104.3 ± 2.3 (2.2%) | 116.4 ± 8.7 (7.5%) | 5021 ± 5 (0.01%) | 105.9 ± 6.3 (5.9%) | 420 ± 88.0 (21%) | 82 ± 25 (31%) | 116 ± 15 (13%) |
| Liposomes (5) | 100.1 ± 3.6 (3.6%) | 105.5 ± 4.0 (3.8%) | - | 98.8 ± 3.5 (3.5%) | 452 ± 6 (1.3%) | 85.5 ± 3.6 (4%) | 89.4 ± 0.4 (0.4%) |
| Modified Vaccinia Ankara (MVA) (5) | 250 ± 3.0 (1.2%) | 323 ± 15.0 (4.6%) | 4877 ± 42 (0.9%) | 178 ± 11 (6.2%) | 428 ± 11 (2.6%) | 119 ± 14 (11%) | 186 ± 7 (3.6%) |
| rAAV5 full 1 (5) | 25.4 ± 0.1 (0.3%) | 26.7 ± 0.2 (0.9%) | - | 25.4 ± 0.1 (0.3%) | - | n/a | n/a |
| rAAV5 empty 1 (5) | 29.5 ± 0.2 (0.5%) | 33.2 ± 0.4 (1.3%) | - | 30.7 ± 0.4 (1.3%) | - | n/a | n/a |
| Monomer | Mw (g/mol) | Mw/Mn | Frac. of Sample (%) | Peak Conc. (mg/mL) | |
|---|---|---|---|---|---|
| rAAV5 Empty 1 | Monomer | 3.79 × 10⁶ ± 2.89 × 10⁴ | 1.004 ± 0.0020 | 91.23 ± 1.09 | 0.341 ± 0.0142 |
| Dimer | 7.1 × 10⁶ ± 5.58 × 10⁵ | 1.011 ± 0.0049 | 6.55 ± 0.72 | 0.025 ± 0.0018 | |
| Aggregates | 2.2 × 10⁷ ± 6.65 × 10⁶ | 1.19 ± 0.0934 | 2.22 ± 0.49 | 0.008 ± 0.0017 | |
| rAAV5 Full 1 | Monomer | 4.52 × 10⁶ ± 7.34 × 10⁴ | 1.001 ± 0.0007 | 94.02 ± 1.26 | 0.411 ± 0.0059 |
| Dimer | 5 × 10⁶ 3 ± 1.34 × 10⁶ | 1.10 ± 0.1133 | 2.48 ± 0.69 | 0.011 ± 0.0030 | |
| Aggregates | 7.8 × 10⁶ 3 ± 2.63 × 10⁵ | 1.12 ± 0.0442 | 3.49 ± 0.57 | 0.015 ± 0.0025 | |
| rAAV5 Empty 2 | Monomer | 3.63 × 10⁶ ± 2.27 × 10⁴ | 1.012 ± 0.0026 | 98.01 ± 0.32 | 0.256 ± 0.0045 |
| Dimer | 7.1 × 10⁶ ± 5.39 × 10⁵ | 1.006 ± 0.0049 | 1.99 ± 0.32 | 0.005 ± 0.0009 | |
| rAAV5 Full 2 | Monomer | 4.43 × 10⁶ ± 2.09 × 10⁴ | 1.007 ± 0.0019 | 96.53 ± 0.30 | 0.191 ±0.0115 |
| Dimer | 7.5 × 10⁶ ± 1.76 × 10⁵ | 1.04 ± 0.0119 | 3.15 ± 0.17 | 0.006 ± 0.0001 | |
| Aggregates | 2.7 × 10⁹ 3 ± 4.67 × 10⁹ | 1.32 ± 0.4908 | 0.33 ± 0.25 | 0.01 ± 0.0005 |
| Delivery Vector (Number of Repeat Measurements) | Polydispersity Index (PdI) 1a (%Pd) | Span (D90–D10)/D50) | Main Population Peak Polydispersity (%Pd) | Mw/Mn 4 | % Monomer 4 |
|---|---|---|---|---|---|
| rAAV5 full (6) | 0.03 ± 0.01 1a (17) | 0.70 ± 0.01 1c, 0.42 ± 0.02 2c n/a 3 | 24.0 ± 0.6 1b, 15.0 ± 0.8 2 | 1.004 | 94.0 |
| rAAV5 empty (6) | 0.12 ± 0.02 1a (34) | 0.90 ± 0.02 1c, 0.61 ± 0.05 2c n/a 3 | 35.5 ± 1.7 1b, 23.2 ± 2.4 2 | 1.001 | 91.2 |
| LNP 1 (5) | 0.325±0.004 1a (57) | 6.95 ± 4.24 1c, 0.92 ± 0.17 2c 0.97 ± 0.19 3 | 43.9 ± 5.3 1b, 33.0 ± 9.4 2 | (1.13) | (100) |
| LNP2 (5) | 0.159±0.017 1a (40) | 1.29 ± 0.17 1c, 0.70 ± 0.16 2c 0.98 ± 0.32 3 | 39.7 ± 3.4 1b, 24.0 ± 3.9 2 | (1.16) | (100) |
| Liposome (5) | 0.032 ± 0.016 1a (18) | 0.75 ± 0.05 1c, 0.46 ± 0.04 2c 0.38 ± 0.02 3 | 24.1 ± 1.7 1b, 16.0 ± 1.9 2 | n/a | n/a |
| MVA (10/5 **) | 0.227 ± 0.020 1a (48) | 1.85± 0.14 1c, Excluded *2c 1.04 ± 0.07 3 | 53.6 ± 4.0 1b, excluded *2 | n/a | n/a |
| Mw (g/mol) | Mw/Mn | Wt Fr (Capsid) (%) | % Full AAV | vp/vg Ratio | AAV Titer (vp/mL) | |
|---|---|---|---|---|---|---|
| Empty rAAV5 | 3,860,000 | 1.011 | 99.82 | 3.71 × 10¹³ | ||
| % RSD | 2.1 | 0.34 | 0.01 | 4.0 | ||
| Full rAAV5 | 4,502,000 | 1.008 | 83.9 | 77.49 | 1.291 | 3.08 × 10¹³ |
| % RSD | 0.47 | 0.21 | 0.13 | 0.47 | 0.47 | 5.7 |
| Empty rAAV9 | 3,798,000 | 1.007 | 99.83 | 4.34 × 10¹³ | ||
| % RSD | 0.79 | 0.18 | 0.12 | 5.1 | ||
| Full rAAV9 | 4,526,000 | 1.015 | 84.13 | 76.97 | 1.299 | 5.35 × 10¹³ |
| % RSD | 0.43 | 0.19 | 0.19 | 1.2 | 1.2 | 2.8 |
| Empty rAAV2 | 3,619,000 | 1.002 | 99.85 | 4.10 × 10¹² | ||
| % RSD | 7.3 | 0.22 | 0.18 | 11 | ||
| rAAV2 Full | 4,513,000 | 1.005 | 83.28 | 80.04 | 1.249 | 1.05 × 10¹³ |
| % RSD | 0.90 | 0.07 | 0.13 | 0.62 | 0.62 | 3.8 |
| Measurement | Zeta Potential (mV) | z-Average Diameters (nm) | ||
|---|---|---|---|---|
| mRNA-LNP1 | mRNA-LNP2 | mRNA-LNP1 | mRNA-LNP2 | |
| 1 | −20.0 | −5.35 | 68.9 | 99.9 |
| 2 | −18.0 | −6.30 | 69.7 | 102.6 |
| 3 | −20.5 | −8.23 | 70.0 | 102.8 |
| 4 | - | - | 69.9 | 102.3 |
| 5 | - | - | 70.2 | 103.1 |
| Mean | −19.5 | −6.63 | 69.7 | 102.1 |
| Standard Deviation | 1.32 | 1.47 | 0.50 | 1.29 |
| Sample | Run # | Tm1, C | Tm2, C | Total Area, mJ |
|---|---|---|---|---|
| mRNA-LNP1 | 1 | 20.9 | 71.7 | 0.633 |
| 2 | 21.4 | 71.1 | 0.687 | |
| mRNA-LNP2 | 1 | 25.6 | 75.0 | 0.204 |
| 2 | 24.6 | 73.6 | 0.197 |
| Attribute | Measurement Techniques | Measurand—Parameter Abbreviation (unit) | Sample Information Required? | Sample Applicability |
|---|---|---|---|---|
| PSD | DLS | Z-average diameter—Dh (nm) | Dispersant viscosity and refractive index | From 0.3 nm to 10–20 µm 1. |
| NTA | Number based size distribution mean or mode (nm) | Dispersant viscosity | From 10 nm to 2 µm 1. | |
| MADLS | Hydrodynamic diameter—Dh (nm) | Dispersant viscosity and refractive index, Particle absorbance and refractive index | From 0.3 nm to 500 nm 1. | |
| SEC-SLS/UV or SLS/RI | Molecular weight—(g/mol) | Particle dn/dc and dA/dc | <200 nm | |
| Polydispersity | DLS (Cumulants Analysis) | Polydispersity Index—PdI | Dispersant viscosity and refractive index | Same as size measurements |
| (DLS NNLS analysis) | Peak polydispersity—%Pd | Dispersant viscosity and refractive index (for volume and number transformations: Particle absorbance and refractive index) | ||
| NTA | Span | Dispersant viscosity | ||
| MADLS | Span | Particle absorbance and refractive index | ||
| SEC-UV or SEC-RI | Mw/Mn | |||
| Particle concentration/Viral capsid titer | MADLS | Particle concentration (particles per mL) | Dispersant viscosity and refractive index, Particle absorbance and refractive index | |
| NTA | Particle concentration (particles per mL) | |||
| SEC-SLS/UV or SLS/RI | Particle concentration (particles per mL) | Particle dn/dc or dA/dc | ||
| Surface charge | ELS | Zeta potential (mV) | Dispersant viscosity | |
| Thermal stability | DSC | Tm, Tonset, ΔH, thermogram profile | ||
| DLS | Trend in light scattering and size | Dispersant viscosity 2 | ||
| Drug payload | SEC-SLS/RI/UV | Vehicle and drug’s dn/dc and dA/dc |
Publisher’s Note: MDPI stays neutral with regard to jurisdictional claims in published maps and institutional affiliations. |
© 2021 by the authors. Licensee MDPI, Basel, Switzerland. This article is an open access article distributed under the terms and conditions of the Creative Commons Attribution (CC BY) license (https://creativecommons.org/licenses/by/4.0/).
Share and Cite
Markova, N.; Cairns, S.; Jankevics-Jones, H.; Kaszuba, M.; Caputo, F.; Parot, J. Biophysical Characterization of Viral and Lipid-Based Vectors for Vaccines and Therapeutics with Light Scattering and Calorimetric Techniques. Vaccines 2022, 10, 49. https://doi.org/10.3390/vaccines10010049
Markova N, Cairns S, Jankevics-Jones H, Kaszuba M, Caputo F, Parot J. Biophysical Characterization of Viral and Lipid-Based Vectors for Vaccines and Therapeutics with Light Scattering and Calorimetric Techniques. Vaccines. 2022; 10(1):49. https://doi.org/10.3390/vaccines10010049
Chicago/Turabian StyleMarkova, Natalia, Stefan Cairns, Hanna Jankevics-Jones, Michael Kaszuba, Fanny Caputo, and Jérémie Parot. 2022. "Biophysical Characterization of Viral and Lipid-Based Vectors for Vaccines and Therapeutics with Light Scattering and Calorimetric Techniques" Vaccines 10, no. 1: 49. https://doi.org/10.3390/vaccines10010049